
Flight planning: Morehouse Memorial BQP / KBQP
What a pilot looks at before a flight from or to Morehouse Memorial in Bastrop, Louisiana, in plain English: right now Wind calm, Temperature 50°F (10°C), dew point 47°F (8°C). The warnings, reports and winds below come from the government's aviation weather service and the restrictions from the FAA, refreshed every few minutes. For planning, not a briefing: the legal preflight briefing comes from Flight Service (1-800-WX-BRIEF) or the FAA's own tools.
the observation as issued, and in English
METAR KBQP 291130Z AUTO 00000KT 10/08 A3018 RMK AO2 T01010084 PWINO
- METAR
- a routine hourly observation
- KBQP
- the station, KBQP
- 291130Z
- observed 6:30 am CDT (11:30 UTC)
- AUTO
- fully automated report, nobody checked it
- 00000KT
- wind calm
- 10/08
- temperature 10 °C (50 °F), dew point 8 °C (46 °F)
- A3018
- altimeter setting 30.18 inches of mercury
- RMK
- remarks follow
- AO2
- automated station with a precipitation sensor
- T01010084
- temperature 10.1 °C (50 °F), dew point 8.4 °C (47 °F)
- PWINO
- the present-weather sensor is not working
Field conditions now density altitude and the wind on each runway, from the latest observation
Field conditions now: elevation 168 ft, altimeter 30.18, 50°F (10°C; standard would be 15°C). Pressure altitude -100 ft. Density altitude -700 ft. The aircraft performs as if the field were at -700 feet: below the field (850 feet lower).
| Runway | Length | Surface | Use end | Wind on it | Room for your book distance |
|---|---|---|---|---|---|
| 16/34 | 4,002 ft | asphalt | either | calm |
Wind calm.
Pressure altitude is the field elevation corrected for today's altimeter setting; density altitude adds the effect of temperature. The aircraft's manual turns these into takeoff and landing distances, climb and fuel burn. Observation KBQP, 6:30 am CDT (11:30 UTC).
Warnings in force SIGMETs and AIRMETs whose area covers this field
No SIGMET or AIRMET covers this field right now.
Turbulence No turbulence warning in force over this field. No pilot has reported turbulence within 100 nautical miles in the last three hours. The government's turbulence forecast map ↗
Icing No icing warning in force over this field. No pilot has reported icing within 100 nautical miles in the last three hours. The freezing level is about 14,500 ft (from the winds-aloft temperatures), so icing is possible in cloud above that. The government's icing forecast map ↗
A SIGMET warns of weather hazardous to all aircraft (thunderstorms, severe turbulence or icing, volcanic ash); an AIRMET of weather that matters to small aircraft and to flying without instruments (moderate turbulence or icing, low cloud, strong surface wind, mountains hidden in cloud). An area is counted when it covers this field's position.
Pilot reports within 100 nautical miles, last three hours, nearest first
Not fetched just now.
What pilots in the air told air traffic control or Flight Service: turbulence, icing, cloud tops and bases, temperature, wind, and whatever they remarked on (wind shear on final, a smooth ride). An urgent report is one of severe turbulence or icing, wind shear, or similar. Open "as filed, and in English" for the coded report and its translation line by line.
Winds and temperatures aloft forecast point JAN, 95 nm east of the field · for use 08:00–15:00 UTC
| Height | Wind from | Speed | Temperature |
|---|---|---|---|
| 3,000 ft | 100° (east) | 8 knots | |
| 6,000 ft | 090° (east) | 7 knots | 14 °C |
| 9,000 ft | 060° (northeast) | 6 knots | 10 °C |
| 12,000 ft | light and variable | 5 °C | |
| 18,000 ft | 280° (west) | 20 knots | -8 °C |
| 24,000 ft | 270° (west) | 40 knots | -21 °C |
| 30,000 ft | 280° (west) | 61 knots | -35 °C |
| 34,000 ft | 270° (west) | 71 knots | -45 °C |
| 39,000 ft | 280° (west) | 88 knots | -54 °C |
Based on data from the 29th at 06:00 UTC; valid on the 29th at 12:00 UTC for use 08:00 to 15:00 UTC; temperatures above 24,000 ft are below zero. Heights are above sea level; the lowest rows are left out where the ground is already that high.
Temporary flight restrictions within 50 nautical miles, from the FAA's list
No temporary flight restriction within 50 nautical miles right now.
Each restriction opens the FAA's own page with the exact area, heights and times.
Notices to air missions closed runways and taxiways, lights and aids out of service, procedures not authorized, obstructions, airspace
5 in force now.
Navigation aids 1
- Navigation aid NDB beacon out of service until Wed 2 Dec, 3:11 pm CST (21:11 UTC), estimated · BQP 06/025
as issued
!DRI 06/025 BQP NAV NDB U/S 2606021437-2612022111EST
Obstructions 3
- Obstruction tower lights (ASR 1244480) 32°50′N 91°52′W (5.2 nautical miles northeast BQP) 477.0FT (350.1FT above ground level) out of service until Thu 12 Nov, 7:30 am CST (13:30 UTC) · BQP 10/454
as issued
!DRI 10/454 BQP OBST TOWER LGT (ASR 1244480) 325034.60N0915230.20W (5.2NM NE BQP) 477.0FT (350.1FT AGL) U/S 2610281430-2611121330
- Obstruction tower lights (ASR 1308999) 32°50′N 91°52′W (5.1 nautical miles north BQP) 514 ft (379 ft above ground level) out of service until Thu 19 Nov, 4:34 pm CST (22:34 UTC), estimated · BQP 10/116
as issued
!DRI 10/116 BQP OBST TOWER LGT (ASR 1308999) 325028.10N0915215.50W (5.1NM N BQP) 514FT (379FT AGL) U/S 2610051636-2611192234EST
- Obstruction tower lights (ASR 1246339) 32°46′N 91°48′W (3.9 nautical miles ENE BQP) 444.9FT (353.0FT above ground level) out of service until Wed 25 Nov, 1:02 am CST (07:02 UTC) · BQP 08/491
as issued
!DRI 08/491 BQP OBST TOWER LGT (ASR 1246339) 324649.30N0914837.20W (3.9NM ENE BQP) 444.9FT (353.0FT AGL) U/S 2608270602-2611250702
Services 1
- Service automated weather Bcst system VIS/WX unreliable until Wed 18 Nov, 5:59 pm CST (23:59 UTC), estimated · BQP 08/528
as issued
!DRI 08/528 BQP SVC AUTOMATED WX BCST SYSTEM VIS/WX UNREL 2608272000-2611182359EST
From the FAA's notice service (NOTAMs), the site's copy refreshed every few minutes; last checked 2 minutes ago. The FAA has so far issued eFlight its test feed, which misses some notices (checked against the FAA's own search on 12 October: about a third missing at Santa Barbara and Burbank, none at Atlanta or Las Vegas); the request for the full feed is with the FAA. Times are local to the field. This is for planning; the legal briefing comes from Flight Service or the FAA's own tools.
Radar and forecast charts government pictures, the latest each time the page loads
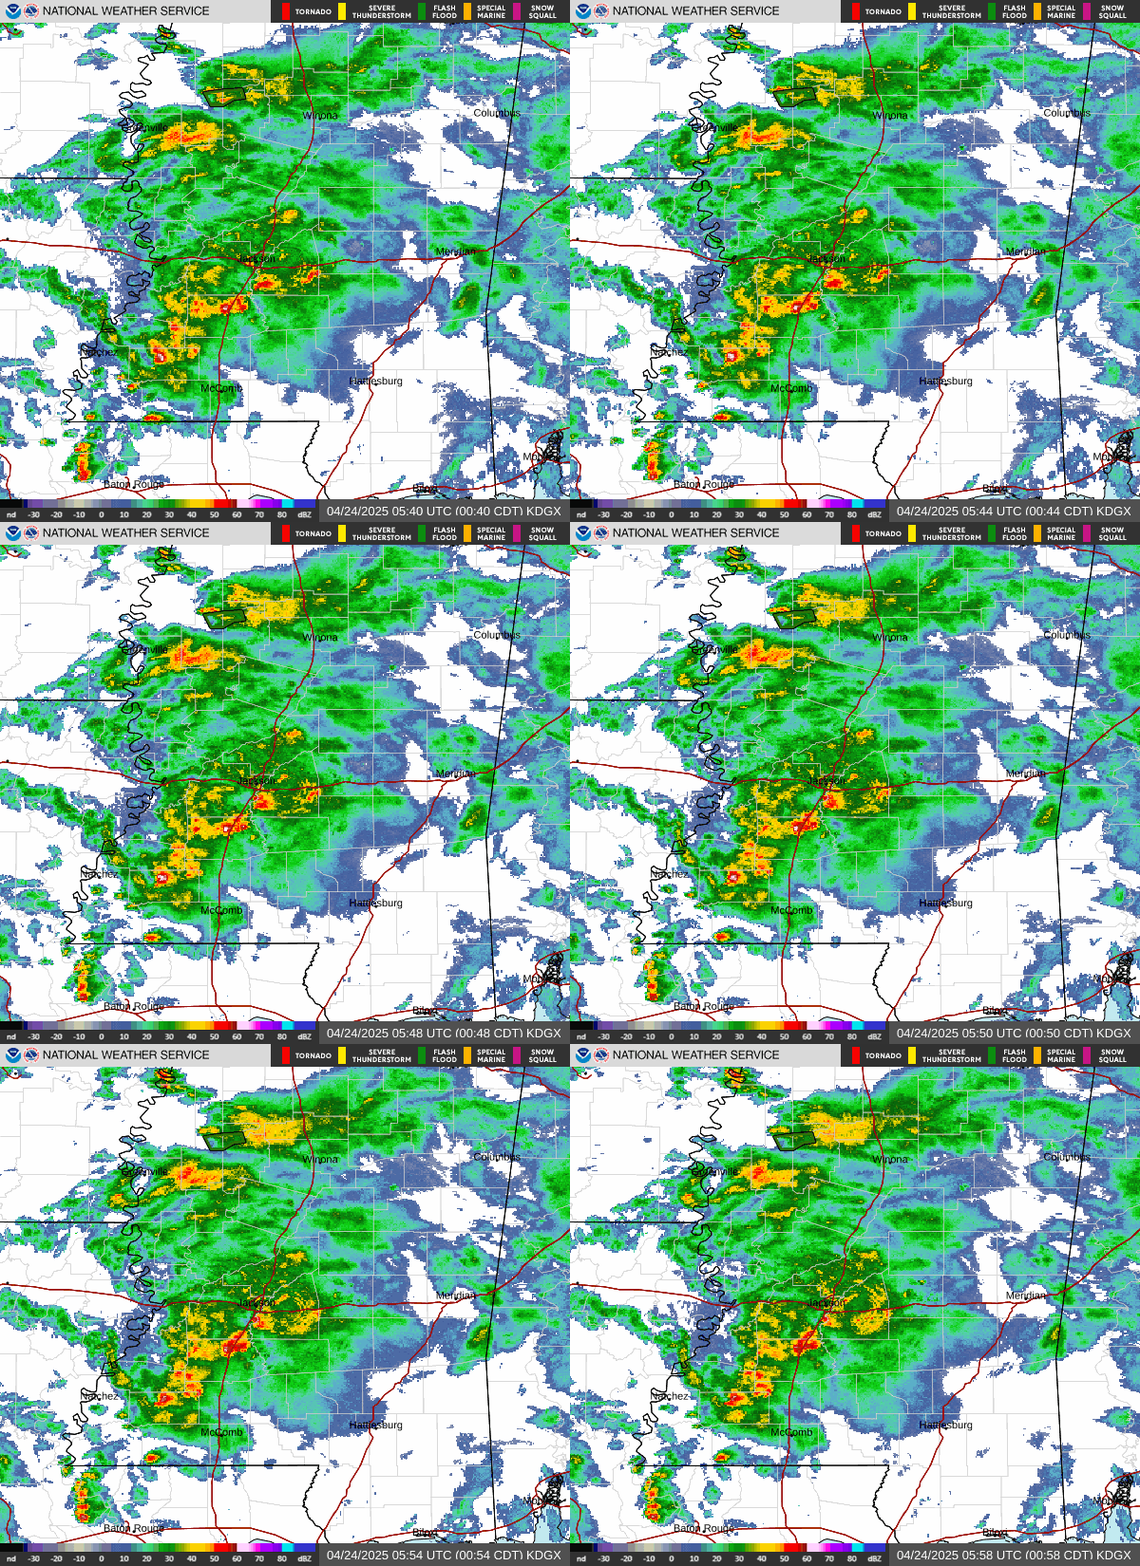
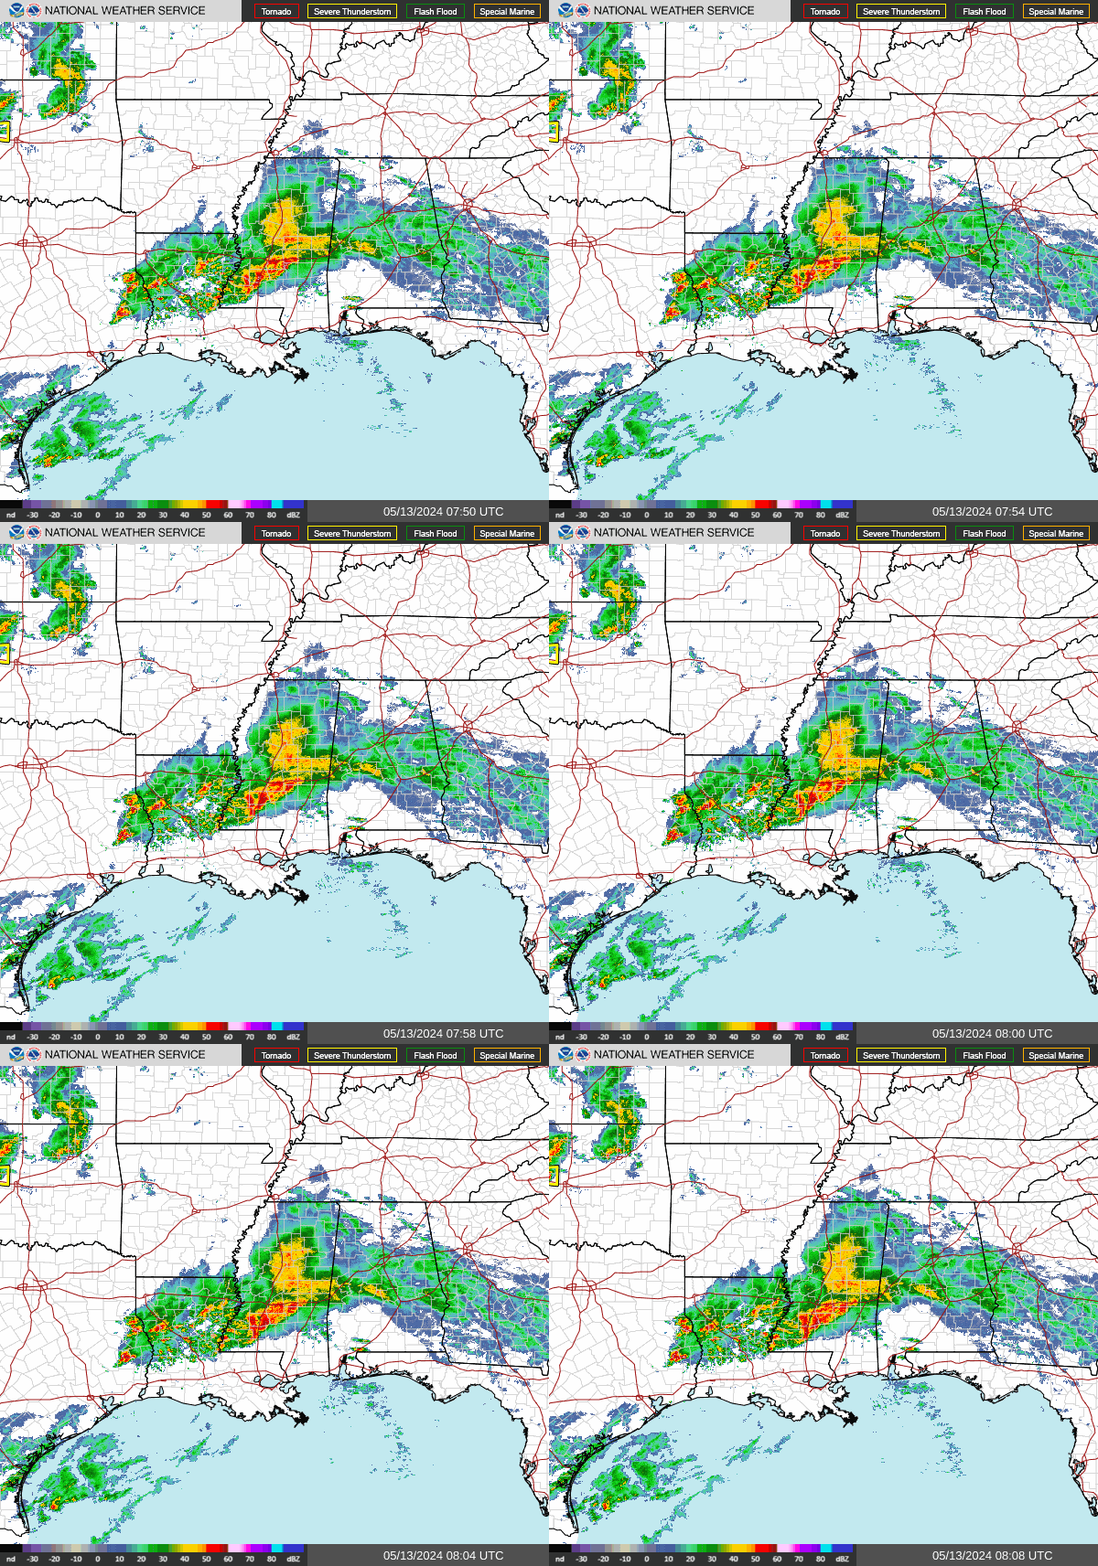


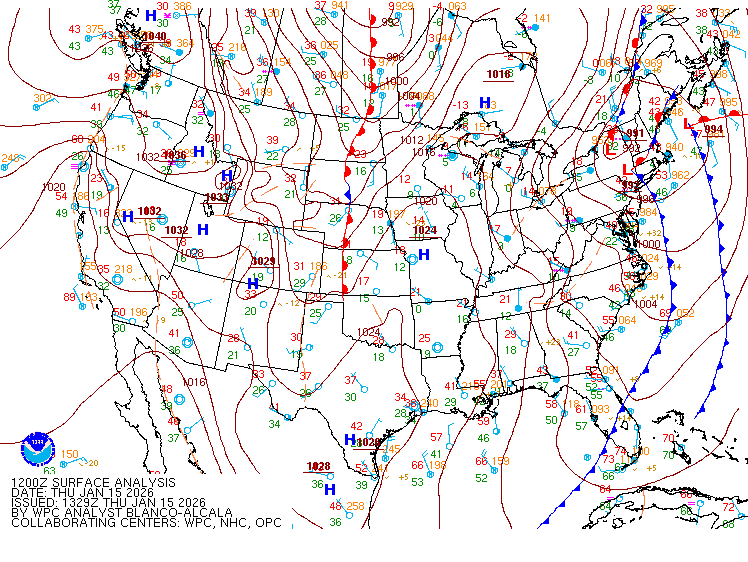
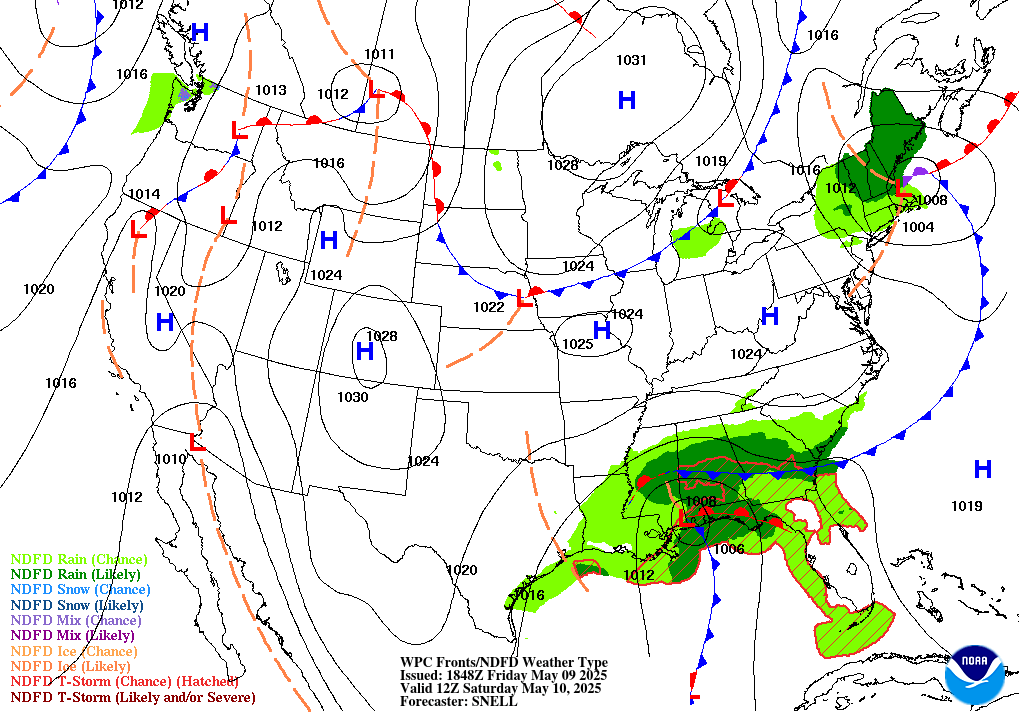
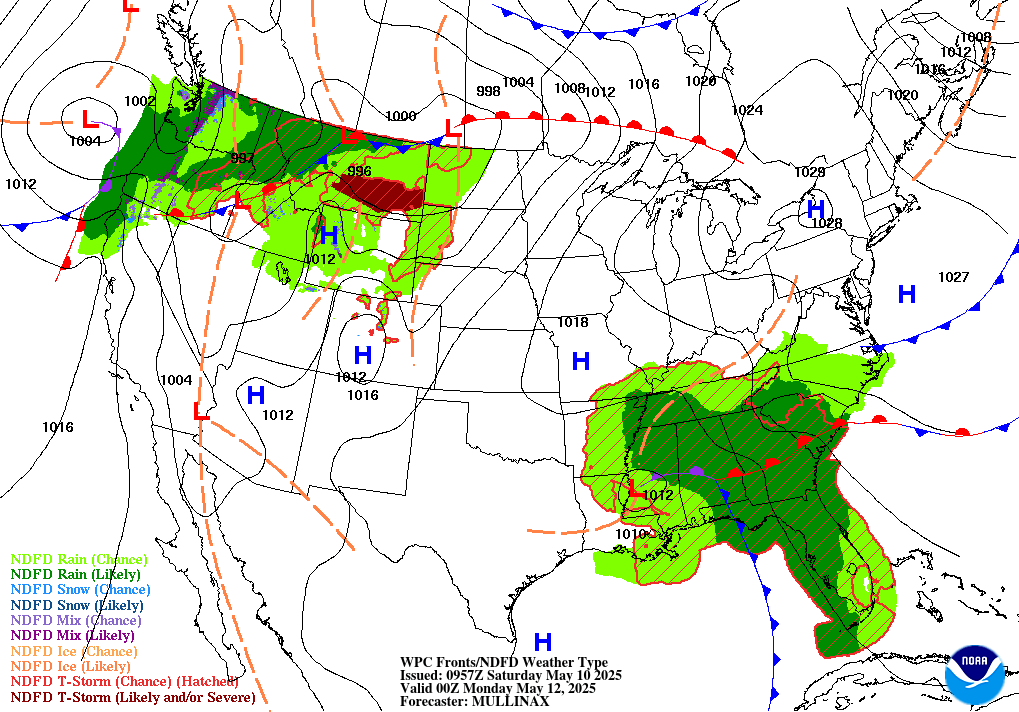
The radar pictures come from the National Weather Service (the nearest radar, then the region); the aviation forecast charts from the Aviation Weather Center's Graphical Forecasts for Aviation (clouds and visibility; surface wind, weather and thunderstorms with the AIRMET boxes); the surface analysis and the 12- and 24-hour forecast charts from the Weather Prediction Center. They are public-domain government images shown as they are published. The turbulence and icing forecasts are drawn live on the Aviation Weather Center's site: turbulence ↗ · icing ↗.
Sources: the Aviation Weather Center's data service (SIGMETs, AIRMETs, graphical AIRMETs, pilot reports, winds and temperatures aloft), the National Weather Service radar, the Weather Prediction Center's charts, and the FAA's temporary flight restriction list and shapes. Fetched when the page is viewed and kept a few minutes. Back to Morehouse Memorial, where the current observation and the forecast for the field are.