
Lakefront Airport to Fort Lauderdale/Hollywood International NEW → FLL
575 nautical miles (662 statute miles) east on a straight line, true course 112°, about 110° magnetic at the departure end (variation 2E). At 120 knots that is 4 h 10 min at the quickest height in today's winds (24,000 ft, a 18-knot tailwind), arriving about 5:21 am EDT (09:21 UTC), after sunset at the destination. For planning, not a briefing: the legal preflight briefing comes from Flight Service (1-800-WX-BRIEF) or the FAA's own tools. Airlines fly this pair: 2 flights in the DOT's last twelve reported months, the route's page.
The route the straight line, the warnings crossed, restrictions, pilot reports and the airports along the way · click a mark for its words
Green, blue, red and purple airport dots are the flying conditions reported there now (VFR, marginal VFR, IFR, low IFR); grey means no report. Red areas are SIGMETs, orange areas AIRMETs, hatched red areas temporary flight restrictions. Map tiles: OpenFreeMap, data © OpenStreetMap contributors.
Warnings the route crosses SIGMETs and AIRMETs whose area the line passes through or comes within 25 nm of
No SIGMET or AIRMET covers any part of this route right now.
A SIGMET warns of weather hazardous to all aircraft; an AIRMET of weather that matters to small aircraft and to flying without instruments. "From 60 to 180 nm out" is measured along the route from NEW.
Pilot reports along the route within 50 nm of the line, last three hours, the serious ones first
Not fetched just now.
Winds aloft along the route, and the time en route the forecast for use 02:00–09:00 UTC · at 120 knots true airspeed
The eastbound cruising heights for this course (VFR: odd thousands plus 500 ft; above 18,000 ft the forecast levels), with the wind averaged along the line from the 5 forecast points nearest it (MSY, MOB, TLH, PIE, MIA). A plus sign is a headwind, a minus sign a tailwind.
| Height | Average wind | Head- or tailwind | Temperature | Ground speed | Time en route | Arrival |
|---|---|---|---|---|---|---|
| 3,500 ft | 340° at 5 kt | −4 kt | 124 kt | 4 h 38 min | 5:49 am EDT (09:49 UTC) | |
| 5,500 ft | 350° at 6 kt | −3 kt | 123 kt | 4 h 40 min | 5:51 am EDT (09:51 UTC) | |
| 7,500 ft | 340° at 6 kt | −4 kt | 16 °C | 124 kt | 4 h 38 min | 5:49 am EDT (09:49 UTC) |
| 9,500 ft | 320° at 7 kt | −6 kt | 12 °C | 126 kt | 4 h 34 min | 5:45 am EDT (09:45 UTC) |
| 11,500 ft | 310° at 8 kt | −8 kt | 9 °C | 128 kt | 4 h 30 min | 5:41 am EDT (09:41 UTC) |
| 13,500 ft | 300° at 10 kt | −10 kt | 5 °C | 130 kt | 4 h 25 min | 5:36 am EDT (09:36 UTC) |
| 15,500 ft | 290° at 11 kt | −11 kt | 0 °C | 131 kt | 4 h 23 min | 5:34 am EDT (09:34 UTC) |
| 17,500 ft | 280° at 13 kt | −13 kt | -5 °C | 133 kt | 4 h 19 min | 5:30 am EDT (09:30 UTC) |
| 18,000 ft FL180 | 280° at 14 kt | −13 kt | -6 °C | 133 kt | 4 h 19 min | 5:30 am EDT (09:30 UTC) |
| 24,000 ft FL240 | 280° at 19 kt | −18 kt | -17 °C | 138 kt | 4 h 10 min | 5:21 am EDT (09:21 UTC) |
| 30,000 ft FL300 | 300° at 19 kt | −18 kt | -32 °C | 138 kt | 4 h 10 min | 5:21 am EDT (09:21 UTC) |
| 34,000 ft FL340 | 290° at 15 kt | −14 kt | -41 °C | 134 kt | 4 h 17 min | 5:28 am EDT (09:28 UTC) |
| 39,000 ft FL390 | 300° at 15 kt | −14 kt | -52 °C | 134 kt | 4 h 17 min | 5:28 am EDT (09:28 UTC) |
Based on data from the 12th at 00:00 UTC; valid on the 12th at 06:00 UTC for use 02:00 to 09:00 UTC; temperatures above 24,000 ft are below zero. Heights are above sea level; a height is left out when the forecast has no wind for it over most of the line (the ground is higher). Ground speed is the airspeed less the headwind; the time en route is for the straight line and ignores climb, descent and routing around weather.
The forecast points as issued
| Point | From | 3,000 | 6,000 | 9,000 | 12,000 | 18,000 | 24,000 | 30,000 | 34,000 | 39,000 |
|---|---|---|---|---|---|---|---|---|---|---|
| MSY | used from 0 nm out; 36 nm from the line | 110/5 | 150/6 19° | L/V 12° | 310/5 7° | 310/13 -4° | 290/20 -16° | 330/36 -31° | 330/37 -41° | 350/43 -52° |
| MOB | used from 50 nm out; 72 nm from the line | 330/5 | 330/6 19° | 340/6 11° | 330/10 7° | 320/16 -5° | 310/26 -16° | 340/40 -32° | 340/47 -42° | 350/51 -52° |
| TLH | used from 198 nm out; 142 nm from the line | 320/18 | 350/31 18° | 340/24 13° | 310/17 8° | 280/22 -7° | 300/25 -17° | 320/28 -33° | 320/24 -41° | 320/25 -50° |
| PIE | used from 297 nm out; 91 nm from the line | 350/6 | L/V 18° | 290/6 14° | 280/9 9° | 250/18 -6° | 250/23 -17° | 240/30 -31° | 220/31 -41° | 220/30 -52° |
| MIA | used from 496 nm out; 58 nm from the line | 150/7 | 140/5 17° | 160/5 14° | L/V 9° | 230/8 -5° | 230/8 -17° | 150/11 -32° | 150/25 -41° | 180/29 -51° |
The weather now: both ends and the airports along the way public airports with a weather report within 25 nm of the line, one for each stretch
| Airport | Where | Conditions | Wind | Visibility | Ceiling | Elevation | Reported |
|---|---|---|---|---|---|---|---|
| NEW New Orleans, LA | departure | no report just now | 7 ft | ||||
| SRQ Sarasota/Bradenton, FL | 426 nm out, 14 nm north of the line, tower | no report just now | 29 ft | ||||
| PGD Punta Gorda, FL | 466 nm out, 3 nm northwest of the line, tower | no report just now | 25 ft | ||||
| FLL Fort Lauderdale, FL | destination | no report just now | 65 ft |
The highest airport on this list sits at 65 ft; the ground between airports is higher still. Check the sectional chart for the terrain and the minimum safe heights along the line.
At FLL when you get there the forecast at the estimated arrival, 5:21 am EDT (09:21 UTC)
FLL has no terminal forecast; use the nearest airport that does.
Temporary flight restrictions on the line or within 25 nm of it
No temporary flight restriction on or near this route right now.
Daylight
Sunset at NEW 6:32 pm CDT (23:32 UTC), at FLL 6:55 pm EDT (22:55 UTC) (civil twilight ends 7:19 pm EDT (23:19 UTC)). At 120 knots the arrival at FLL is before sunrise there (7:17 am EDT (11:17 UTC)).
Each restriction opens the FAA's own page with the exact area, heights and times. Ordinary notices to air missions (closed runways, lights out) are not shown: the FAA's notice search is not open to sites like this one at this time.
Radar and forecast charts for the regions crossed government pictures, the latest each time the page loads
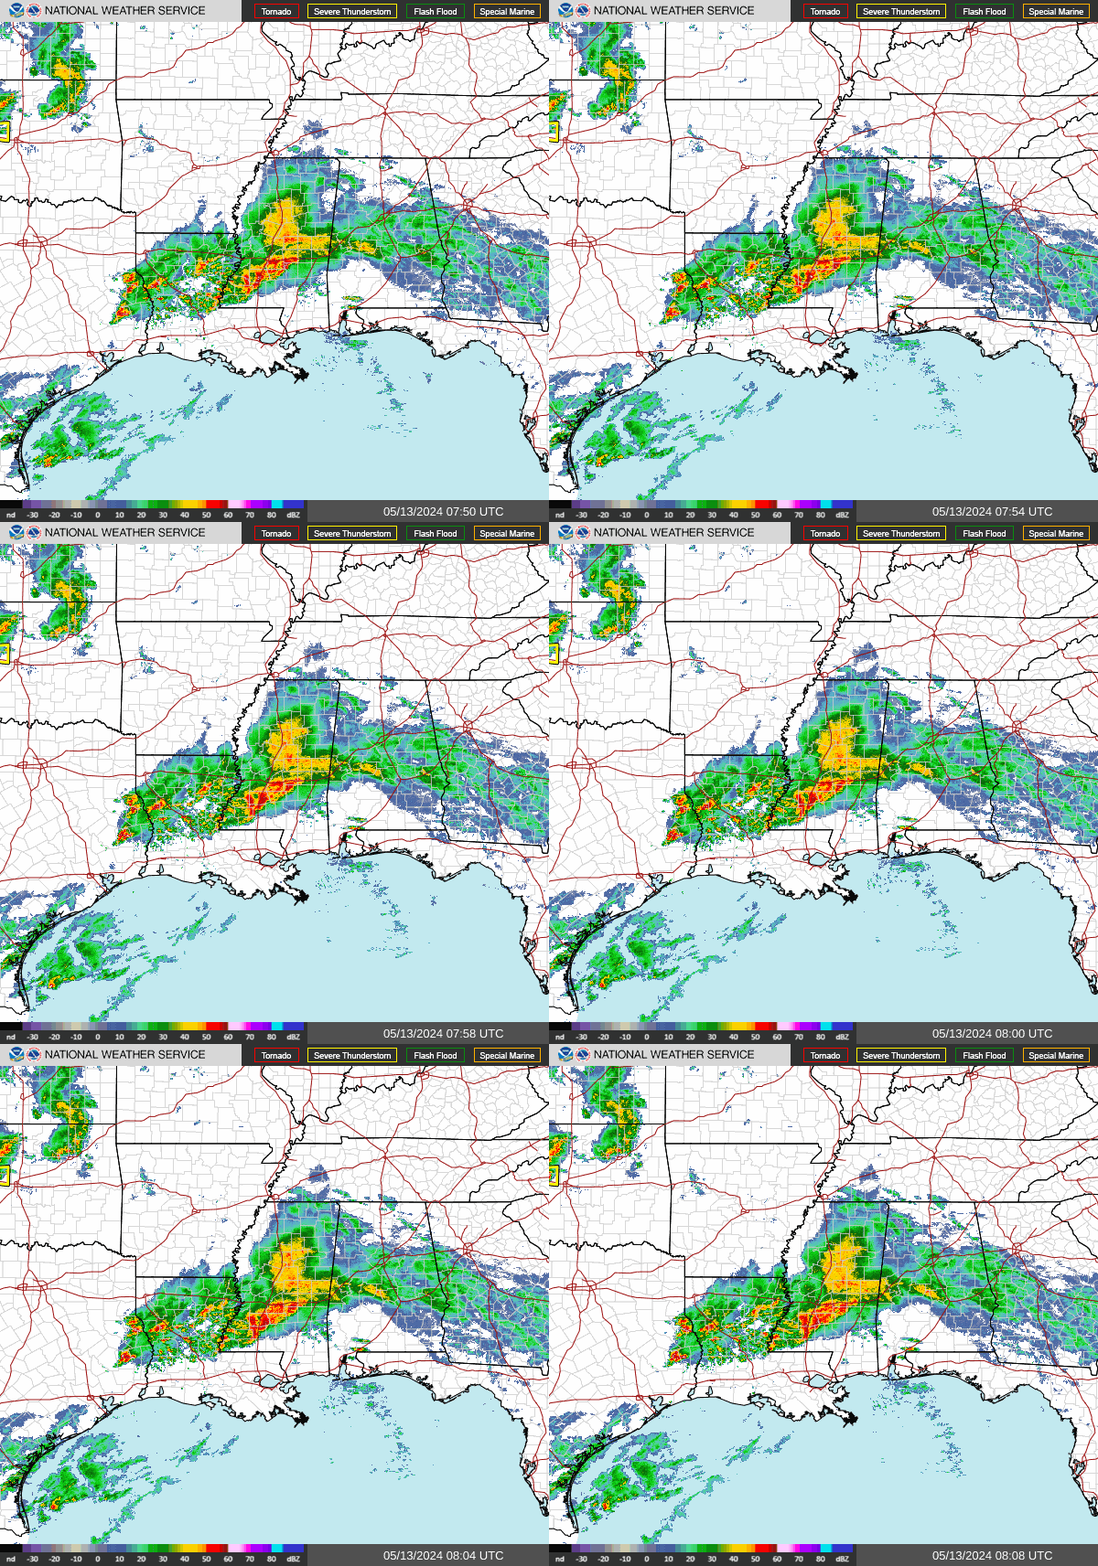
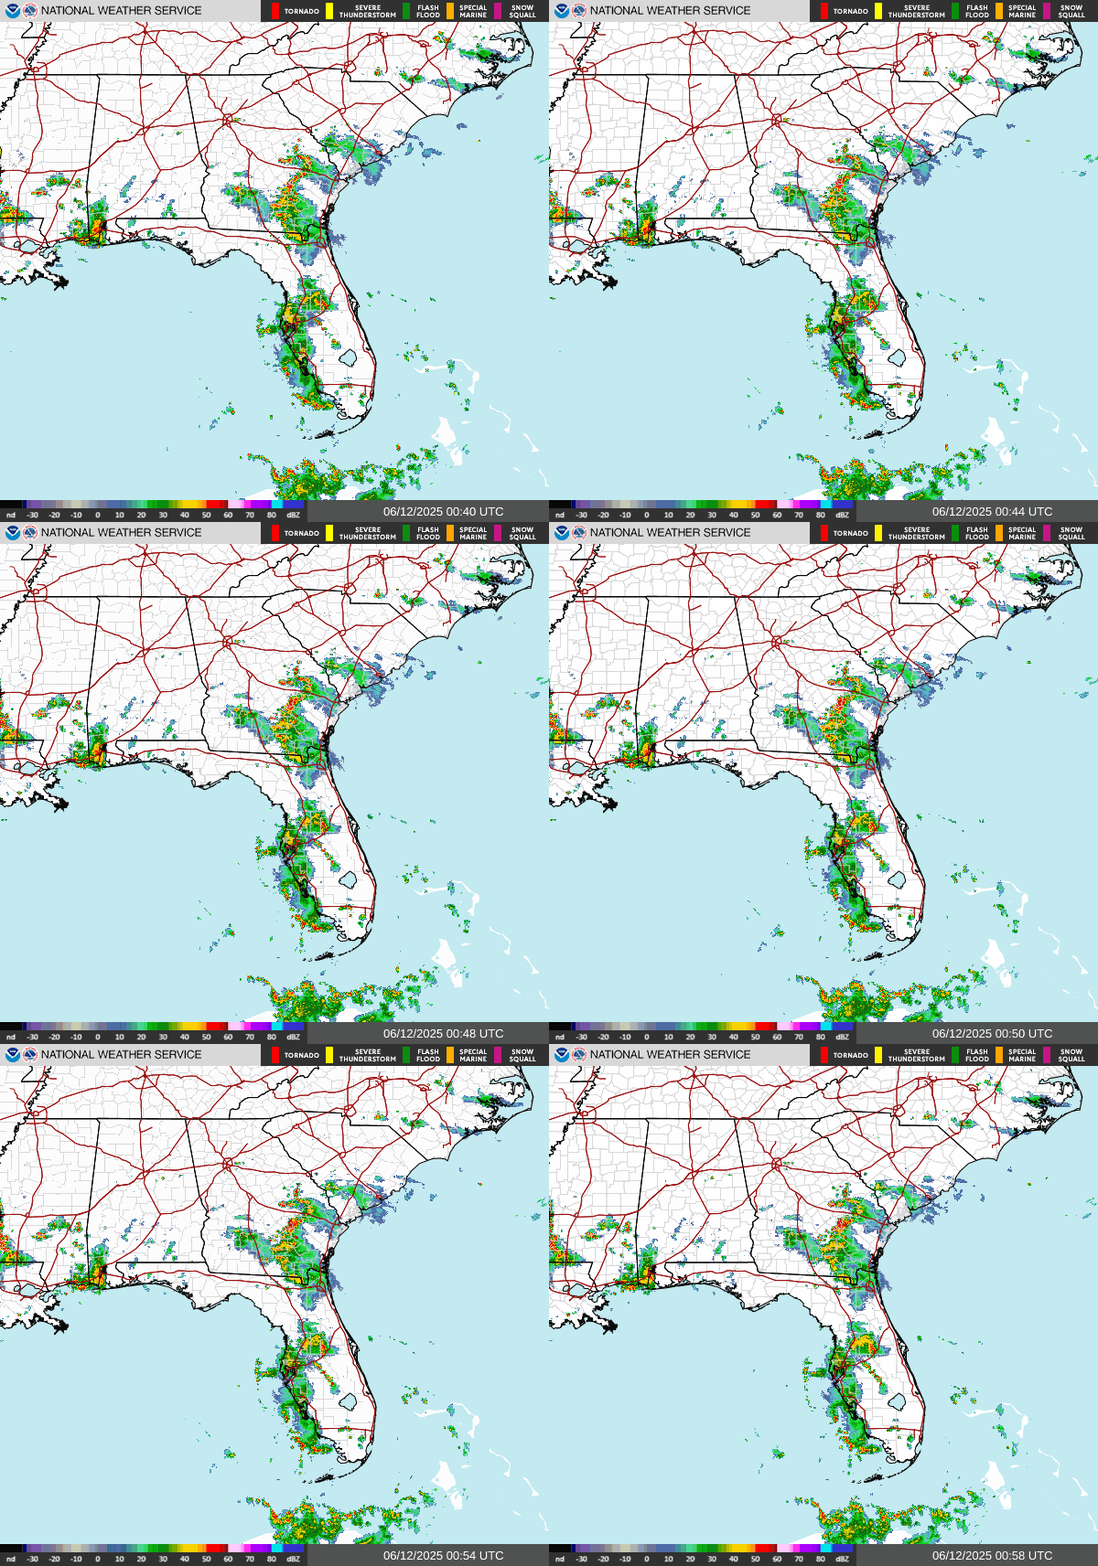
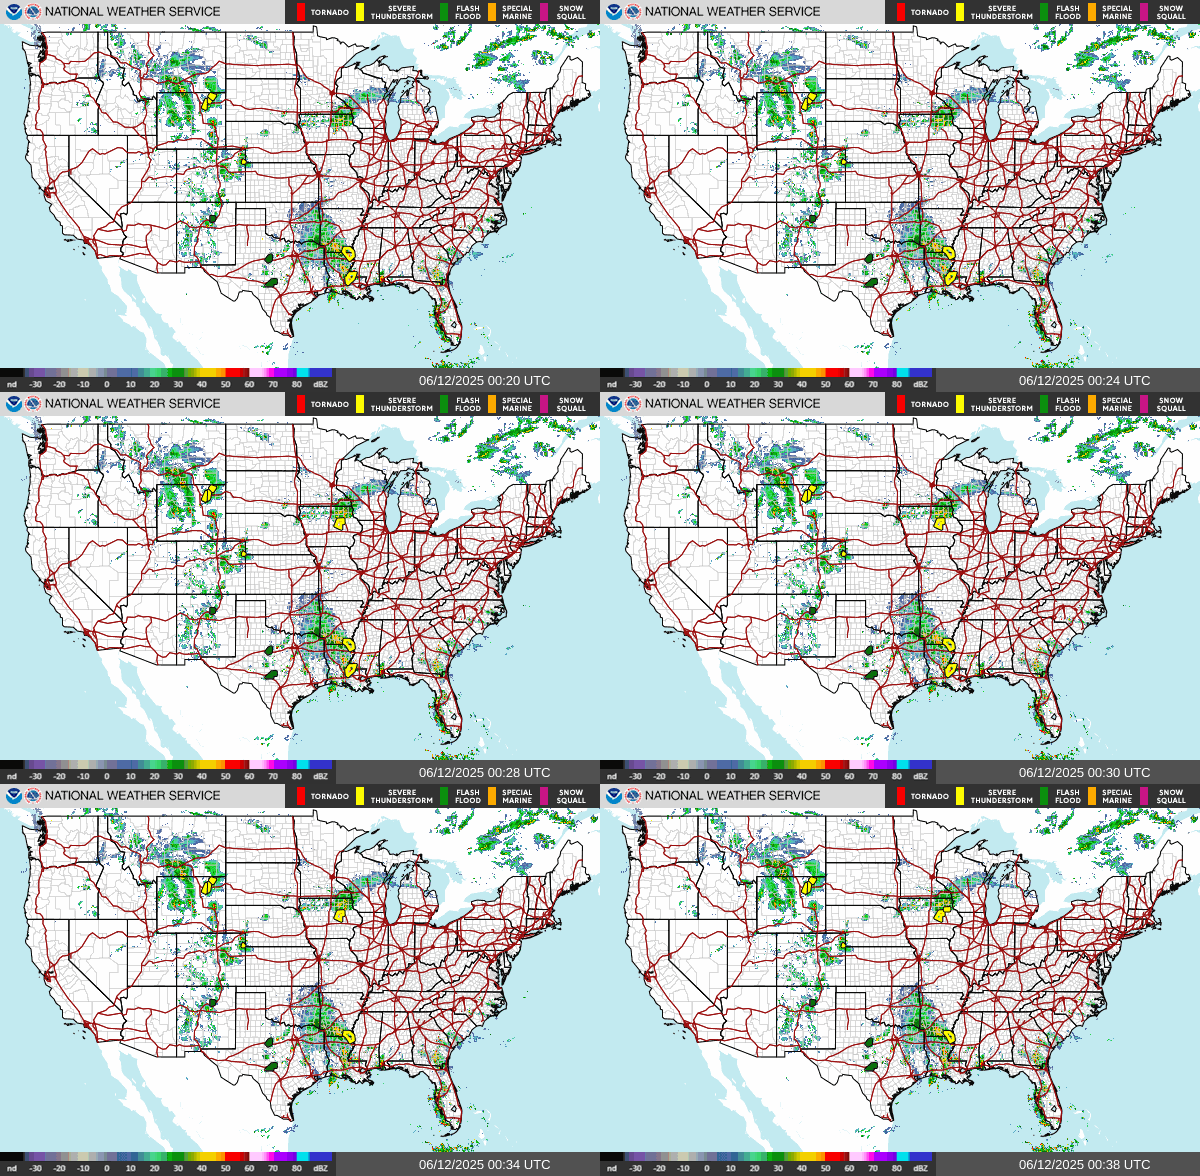
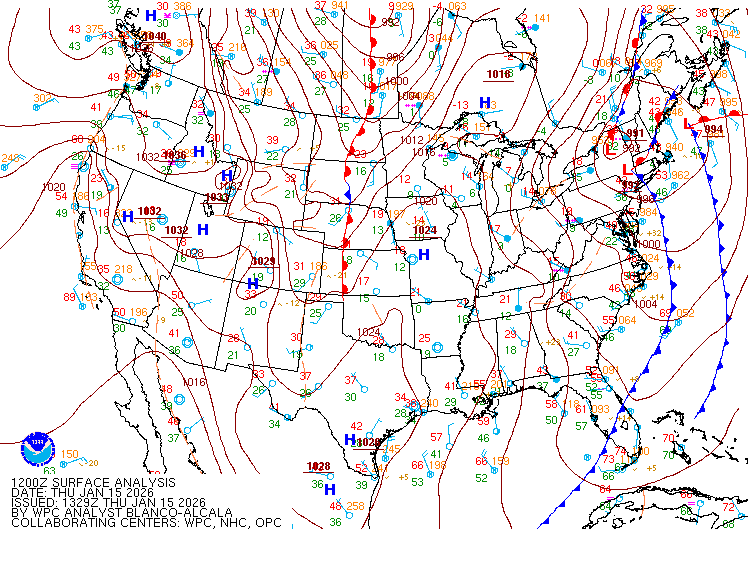
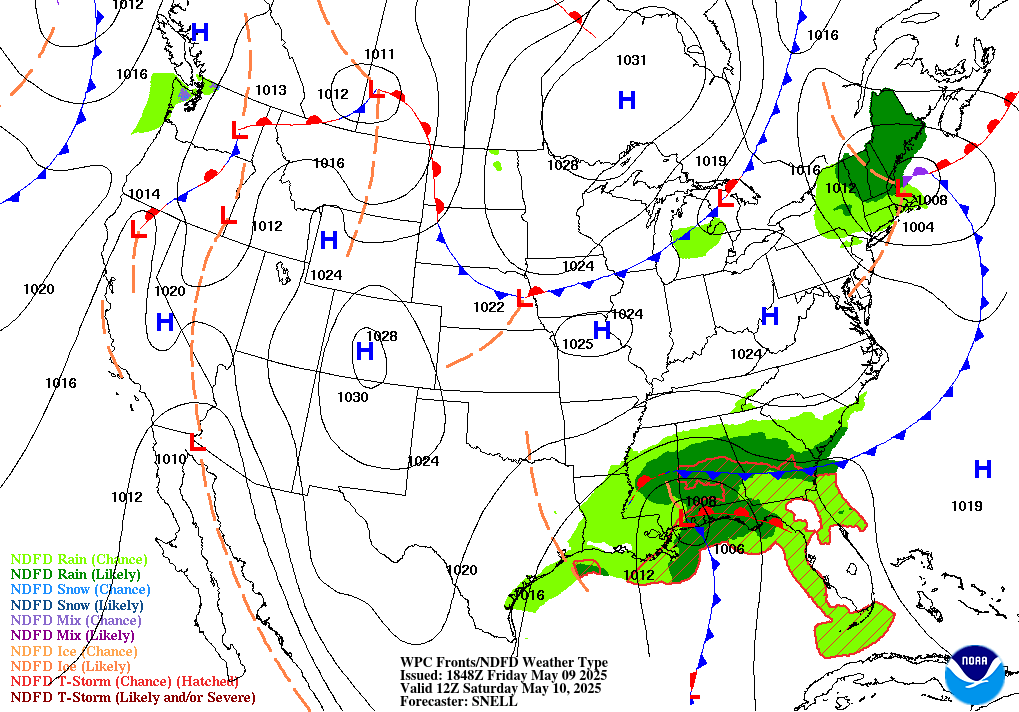
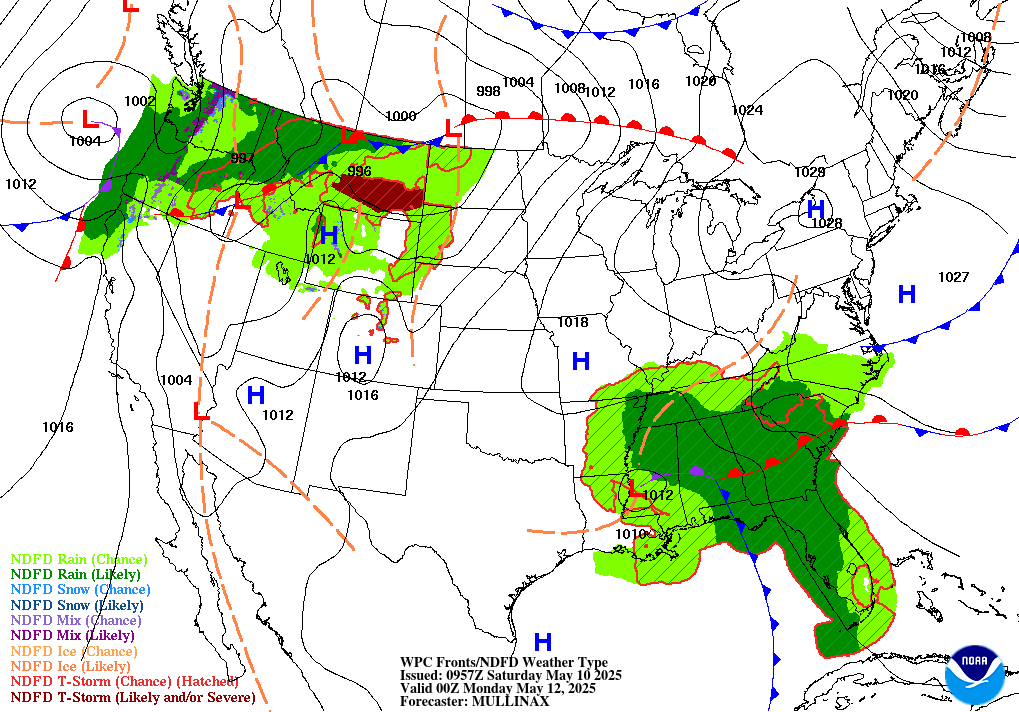
Sources: the Aviation Weather Center's data service (SIGMETs, AIRMETs, graphical AIRMETs, pilot reports, winds and temperatures aloft, observations and terminal forecasts), the National Weather Service radar, the Weather Prediction Center's charts, the FAA's temporary flight restriction list and shapes, and the FAA's airport file for the positions, elevations and magnetic variation. Fetched when the page is viewed and kept a few minutes. Each leg is the straight line between its two airports; airways, terrain and airspace are not considered. The airports in detail: Lakefront Airport, Fort Lauderdale/Hollywood International.