
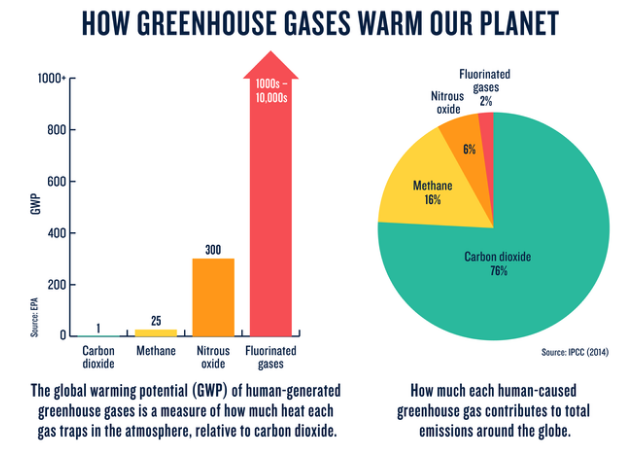
Earth’s greenhouse gases trap heat in the atmosphere and warm the planet. The main gases responsible for the greenhouse effect include carbon dioxide, methane, nitrous oxide, and water vapor (which all occur naturally), and fluorinated gases (which are synthetic). Greenhouse gases have different chemical properties and are removed from the atmosphere, over time, by different processes. Carbon dioxide, for example, is absorbed by so-called carbon sinks such as plants, soil, and the ocean. Fluorinated gases are destroyed only by sunlight in the far upper atmosphere.
How much any one greenhouse gas influences global warming depends on three key factors. The first is how much of it exists in the atmosphere. Concentrations are measured in parts per million (ppm), parts per billion (ppb), or parts per trillion (ppt); 1 ppm for a given gas means, for example, that there is one molecule of that gas in every 1 million molecules of air. The second is its lifetime—how long it remains in the atmosphere. The third is how effective it is at trapping heat. This is referred to as its global warming potential, or GWP, and is a measure of the total energy that a gas absorbs over a given period of time (usually 100 years) relative to the emissions of 1 ton of carbon dioxide.
According to the IPCC, human-caused greenhouse gas emissions have increased since the pre-industrial era and are now higher than ever. About half of the total emissions have occurred in the last 40 years, and 40% of the human-caused emissions have remained in the atmosphere. The rest have been removed from the atmosphere and stored on land in plants and soils, and in the oceans. The oceans have absorbed about 30% of the human caused CO2, which, in turn has created negative side effects such as ocean acidification. Higher concentrations of CO2 in the ocean are already having devastating impacts to coral reefs, marine life, entire marine eco-systems, global climate patterns, and atmospheric oxygen levels. The effectiveness of these CO2 sinks will continue diminishing in the future under a changing climate and increasing human impacts.
A changing climate is already having major ecological, physical and health impacts, including extreme weather events (such as floods, droughts, storms, and heatwaves); sea-level rise; altered crop growth; and disrupted water systems. The most extensive source of analysis on the potential impacts of climatic change can be found in the 5th Intergovernmental Panel on Climate Change (IPCC) report.
- Carbon dioxide (CO2) is the primary greenhouse gas (GHG) contributing to the enhanced greenhouse effect. While CO2 has a large variety of natural sources and sinks, human activities are responsible for the considerable increase of CO2 in the atmosphere that has occurred since the start of the industrial revolution. Human emissions of CO2 are a primary driver of climate change (global warming) and present an existential threat to the survival of our civilization, and possibly to human life on our planet. [1]IPCC, 2013: Climate Change 2013: The Physical Science Basis. Contribution of Working Group I to the Fifth Assessment Report of the Intergovernmental Panel on Climate Change [Stocker, T.F., D. Qin, … Continue reading
CO2 also occurs naturally in the atmosphere as part of the Earth’s natural carbon cycle – the natural circulation of carbon among the air, water and ecosystems. Human activities are also altering the natural carbon cycle either by adding CO2 to the atmosphere (primary activities being burning of fossil fuels (coal, oil, natural gas) and wood) or by influencing the ability of natural sinks (which are affected by deforestation and other land use changes) to remove CO2 from the atmosphere.
This link between global temperatures and greenhouse gas concentrations – especially CO2 – has been true throughout Earth’s history [2] [Lacis, A. A., Schmidt, G. A., Rind, D., & Ruedy, R. A. (2010). Atmospheric CO2: Principal control knob governing Earth’s temperature. Science, 330(6002), 356-359.
The heat-trapping nature of CO2 and other gases was first demonstrated in the mid-19th century [3]In 1824, Joseph Fourier calculated that an Earth-sized planet, at our distance from the Sun, ought to be much colder. He suggested something in the atmosphere must be acting like an insulating … Continue reading.
The Integrated Carbon Observation System (ICOS) measures the most important greenhouse gases in the atmosphere, ecosystems and ocean: carbon dioxide (CO2), methane (CH4), nitrous oxide (N2O) and water vapor (H2O). ICOS’s earth-orbiting satellites and other technologies enable scientists to see the big picture by collecting many different types of information about our planet and its climate on a global scale, with a specific focus on Carbon Dioxide (CO2), along with other gases. The ability of these gases to affect the transfer of infrared energy through the atmosphere is the scientific basis of many instruments flown by NASA. This body of data, collected over many years, have revealed the alarming signals of a rapidly changing climate.
Human produced CO2 is a byproduct of the incomplete combustion of fossil fuels, and specifically coal. In 2013, CO2 accounted for about 82 percent of all U.S. greenhouse gas emissions from human activities. The U.S. Environmental Protection Agency (EPA) website reports that “human activities are altering the carbon cycle—both by adding more CO2 to the atmosphere and by influencing the ability of natural sinks, like forests, to remove CO2 from the atmosphere. Human-related emissions are responsible for the 33% increase in atmospheric CO2 since the beginning of the Industrial Age. Projections over coming years see that trend continuing and accelerating.
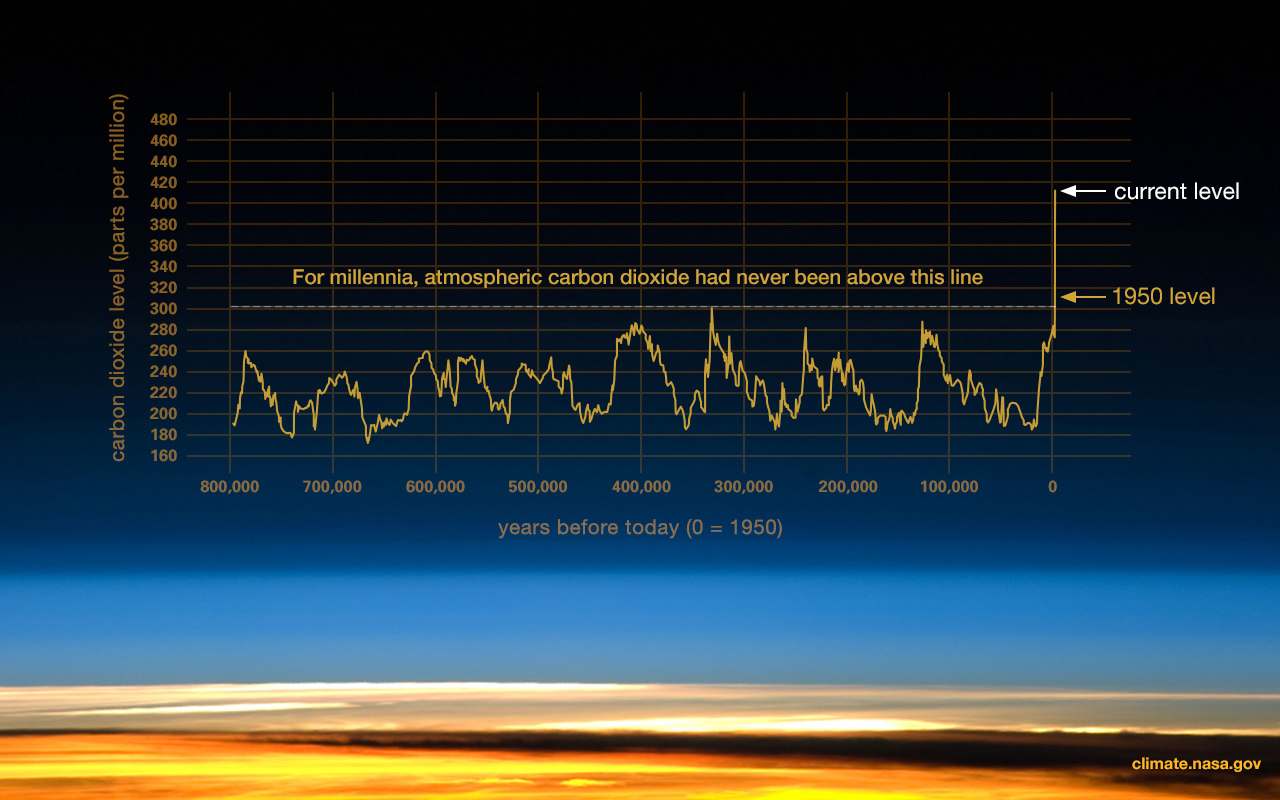
The figure below shows a comparison of atmospheric samples contained in ice cores, and more recent direct measurements. It provides incontrovertible evidence that atmospheric CO2 is increasing at an almost geometric pace since the start of the Industrial Revolution.
The Rapid Increase in Atmospheric CO2 since the start of the Industrial Revolution (Credit: Luthi, D., et al.. 2008; Etheridge, D.M., et al. 2010; Vostok ice core data/J.R. Petit et al.; NOAA Mauna Loa CO2 record.
The longest and most well-known records of direct, modern day, CO2 measurement come from the Mauna Loa Observatory (MLO) in Hawaii. The MLO has been measuring atmospheric composition since the 1950s, providing the clearest record of CO2 concentrations across the 20th and 21st century.
Very long-term CO2 concentrations have also been reconstructed by scientists using geological and chemical analogues which record changes in atmospheric composition through time. A widely accepted method to create these long term measurements is ice-coring. Ice cores provide a preserved record of atmospheric compositions—with each layer representing a date further back in time, and can extend as deep at 3km. Ice cores preserve tiny bubbles of air which provide a snapshot of the atmospheric composition of a given period. Using chemical dating techniques, e.g. isotopic dating, scientists can relate time periods to depths in an ice core. The process of ice-coring allows for the longest extension of historical CO2 records, extending back 800,000 years.
The most famous ice core used for historical reconstructions is the Vostok Ice Core in Antarctica. This core extends back 420,000 years and covers four glacial-interglacial periods. Scientists, using the Vostok Ice Core section from a depth of 500m, were able to estimate that it was formed approximately 30,000 years ago. Sensors then measured the CO2 concentration in air bubbles from the ice-core, finding a concentration of approximately 190 parts per million. Combining these two methods, researchers estimate that 30,000 years ago, the CO2 concentration was 190ppm. Repeating this process across a range of depths, the change through time in these concentrations can be reconstructed. Ice cores drawn from Greenland, Antarctica, and tropical mountain glaciers show that Earth’s climate responds to changes in greenhouse gas levels. Ancient evidence can also be found in tree rings, ocean sediments, coral reefs, and layers of sedimentary rocks.
Comparing this ancient paleoclimate evidence with the record from the Mauna Loa Observatory reveals that current warming is occurring roughly ten times faster than the average rate of ice-age-recovery warming; and CO2 from human activity is increasing more than 250 times faster than it did from natural sources after the last Ice Age.
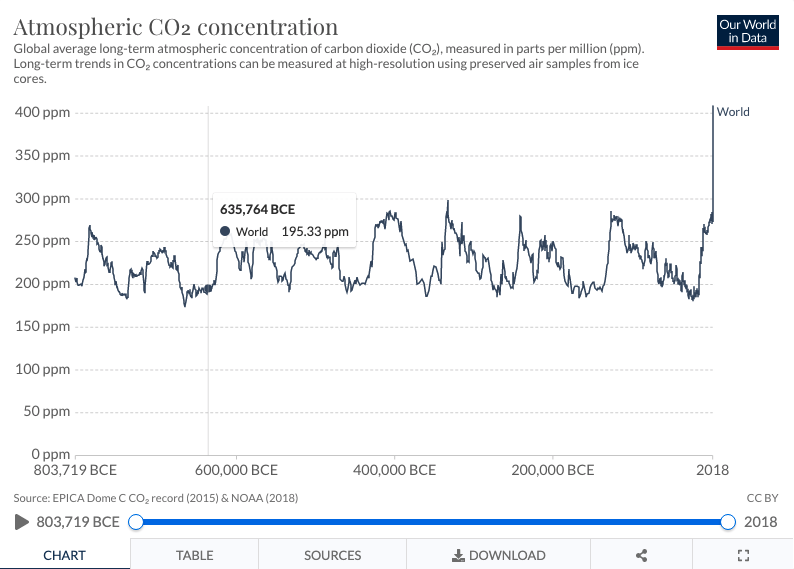
The Atmospheric CO2 Concentration graph below covers the past 800,000 years, and shows the global average concentrations of CO2, with consistent fluctuations in CO2 concentrations; these periods of rising and falling CO2 coincide with the onset of ice ages (low CO2) and interglacials (high CO2) . These periodic fluctuations are caused by changes in the Earth’s orbit around the sun – called Milankovitch cycles.
Atmospheric CO2 Concentration – Interactive Graph Link
Between 800,719 BCE (Before Common Era) and CY 1730 the atmospheric concentrations of CO2 did not exceed 300 parts per million (ppm). The Industrial Revolution (circa 1734 onwards) changed that, with the rise of human emissions of CO2 from burning fossil fuels (starting around 1794) fueling a rapid rise in global CO2 concentrations, especially in recent decades.
The rate of change of CO2 in the atmosphere has also accelerated, far outstripping historical rates which happened over centuries or thousands of centuries. This acceleration is not giving the planetary systems, the ecosystems, and the current species enough time to evolve and adapt, creating another mass extinction event.
Current CO2 concentrations are the highest they’ve been in at least 800,000 years. Atmospheric concentrations have now broken the 400ppm threshold—considered the highest level in the last three million years.
Even if the world achieved a stabilization in CO2 emissions, it would not translate into the same for atmospheric concentrations. This is because CO2 accumulates in the atmosphere based on what we call a ‘residence time’. Residence time is the time required for emitted CO2 to be removed from the atmosphere through natural processes in Earth’s carbon cycle. The length of this time can vary—some CO2 is removed in less than 5 years through fast cycling processes, meanwhile other processes, such as absorption through land vegetation, soils and cycling into the deep ocean can take hundreds to thousands of years. If we stopped emitting CO2 today, it would take several hundred years before the majority of human emissions were removed from the atmosphere.
To slow down and halt rising global temperatures we must immediately stabilize concentrations of CO2 and other greenhouse gases in the Earth’s atmosphere. It’s important to note that there is ‘lag’ between atmospheric concentrations and final temperature rise – this means that when we do finally manage to stabilize atmospheric concentrations, temperatures will continue to slow rise for years to decades.
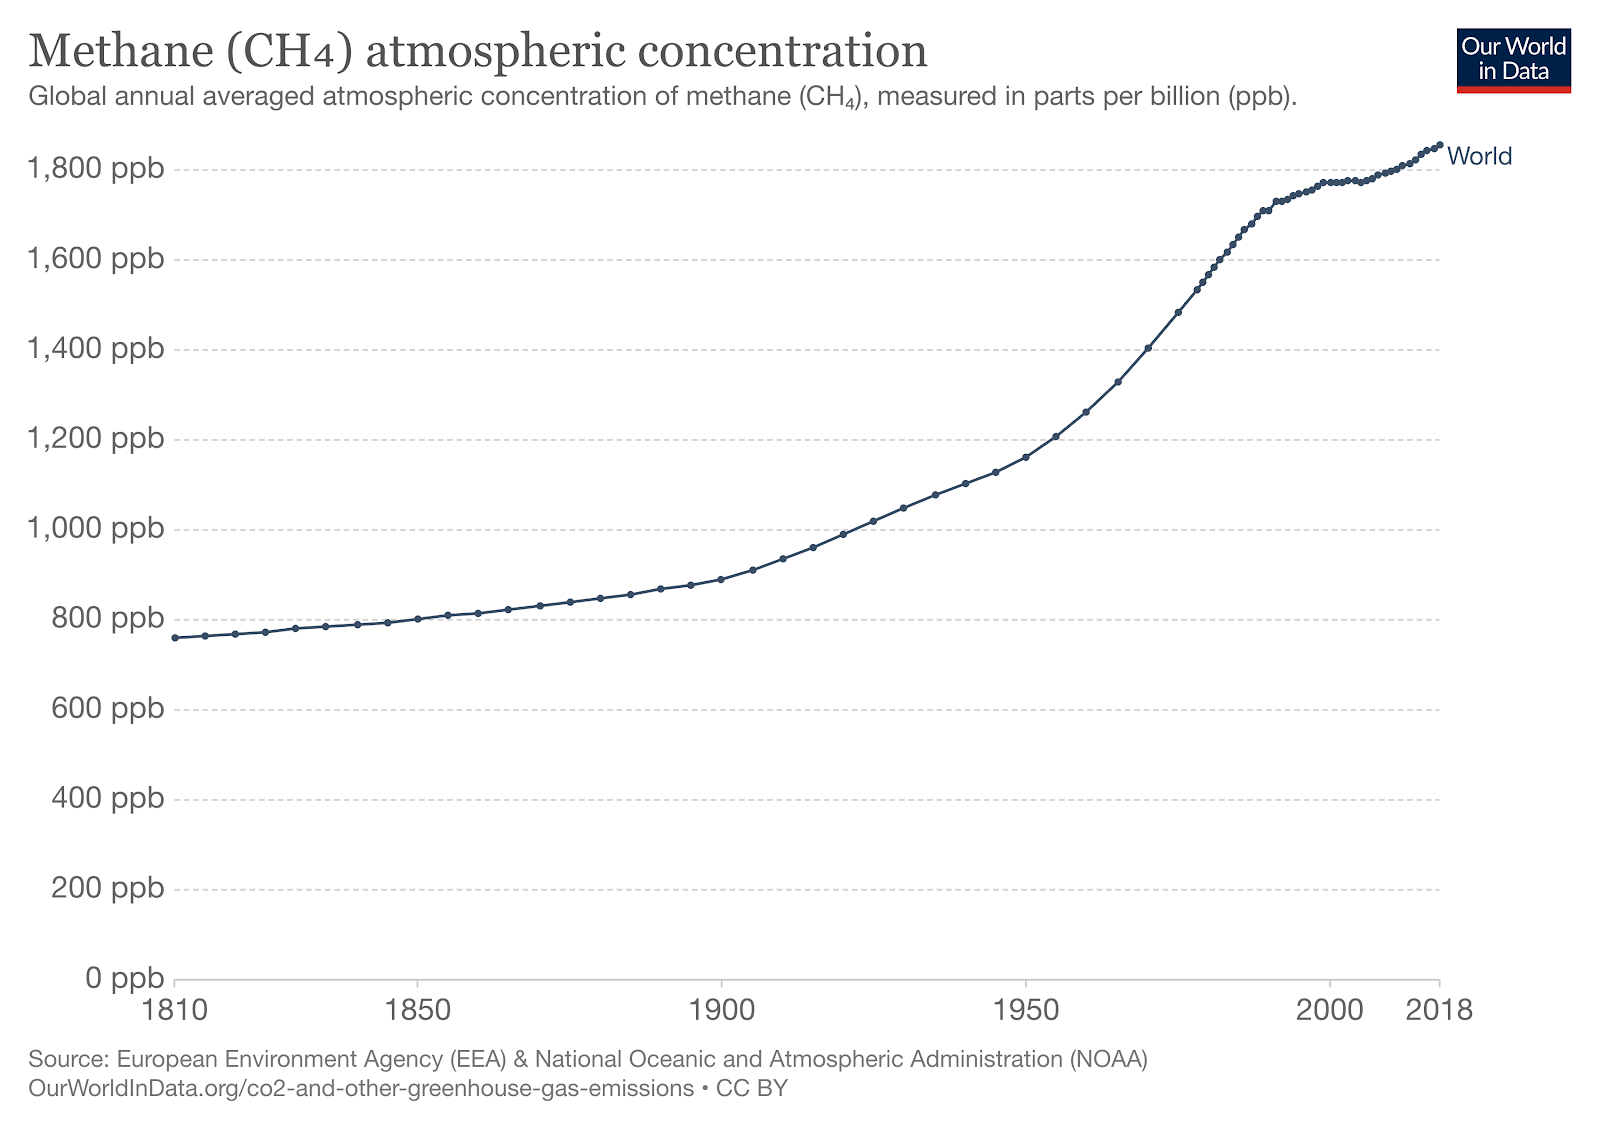
- Methane (CH4) is the second most important GHG contributing to the enhanced greenhouse effect, after carbon dioxide (CO2). Emissions of CH4 from human activities have exceeded natural emissions since the 1980s. CH4 concentrations grew an average of six times faster from 1960 to 1999 than over any previous 40-year period during the 2000 years before CY1800. The concentration in 2018 was 1797 ppb, about 2.5 times higher than during the preindustrial period.[4]Global Bio-Chemical Cycles https://agupubs.onlinelibrary.wiley.com/doi/full/10.1029/2018GB006009. CH4 now bubbles from shallow newly-formed lakes caused by permafrost subsidence and collects under the ice when these lakes freeze over in the winter. Poking a hole in the ice and igniting the resulting rush of gas produces a striking effect.
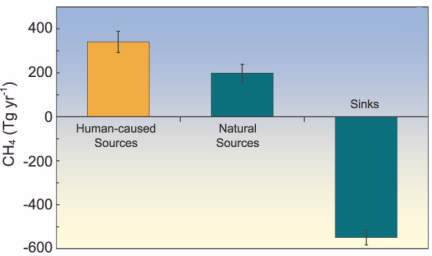
Methane is emitted by natural and human sources. Natural sources make about 36% of methane emissions. The main natural sources of methane include wetlands (marsh gas produced by the anaerobic decay of vegetation), permafrost (Tundra) melting caused by the warming planet in the Arctic along with the accompanying decay of vegetation that had been frozen, oceans and their bottom sediments, and termites.
Human activities that produce CH4 include energy production from natural gas, coal and petroleum, decomposition in landfills, landfills, livestock farming (especially enteric fermentation in farm animals), rice farming, biomass burning, as well as the production, transportation and use of fossil fuels. Human-caused sources create the majority of methane emissions, accounting for about 64% of the total emissions.
Credit: IPCC & The American Chemical Society
In the 1990s, the atmospheric methane was trending toward equilibrium with little or no growth in the early years of this century. [5]Dlugokencky et al., 2011. However, atmospheric methane (CH4) concentrations started to rise in 2007, with Methane growing rapidly to a new annual global mean of 1,850 ppb in 2017, a total rise of about 75 ppb in the 2007–2017 period, and the increase is continuing. To put this in context preindustrial methane was about 720 ppb around 1750 C.E. [6] (Etheridge et al., 1998). Thus, the decade of recent growth is equivalent to more than 6% of total growth to date since industrialization began. The growth has been worldwide, especially in the tropics and northern midlatitudes. There is now urgent need to reduce methane emissions, especially from the fossil fuel industry.
Methane Concentrations – Interactive Graph
If Methane growth continues at similar rates through the coming decade the extra climate warming impact of the methane could reverse progress in climate mitigation achieved by reducing CO2 emissions. This will negate efforts to meet the target of the 2015 UN Paris Agreement on Climate Change to limit climate warming to 2°C.
The factors behind the recent rise in methane need to be determined and addressed urgently to limit global warming within the 2°C limit. If the main causes for the increase of methane in the atmosphere are increased human caused emissions, they need to be reduced. If the increased methane is driven by increased emissions from natural sources, and if this is a climate feedback—the warming feeding the warming which we can’t control—then there is also even more extreme urgency to reduce human caused emissions, which we can control. If, however, the increase in the methane burden is driven by a decline in the oxidative capacity of the atmosphere, and this is a climate feedback, then the implications are serious indeed, and geo-engineering on a large scale might be required.
Reducing methane emissions is feasible, especially from fossil fuel sources, and would have rapid impact on the global methane burden. However, it is a huge challenge and there is no single silver bullet. Development and implementation of methane draw-down and sequestration systems must be accelerated and coupled with a global focus on reducing methane emissions, especially from fossil fuels and biomass burning, to achieve the 2°C limit for global warming.
- Nitrous Oxide: Nitrous oxide (N2O) is the third most important GHG for the enhanced greenhouse effect after carbon dioxide (CO2) and methane (CH4). Although there is a relatively small amount of N2O in the atmosphere, it has a long (~120 years) lifetime, which makes it very important for the total amount of global greenhouse gases in the atmosphere. N2O has nearly 300 times the global warming potential of carbon dioxide.
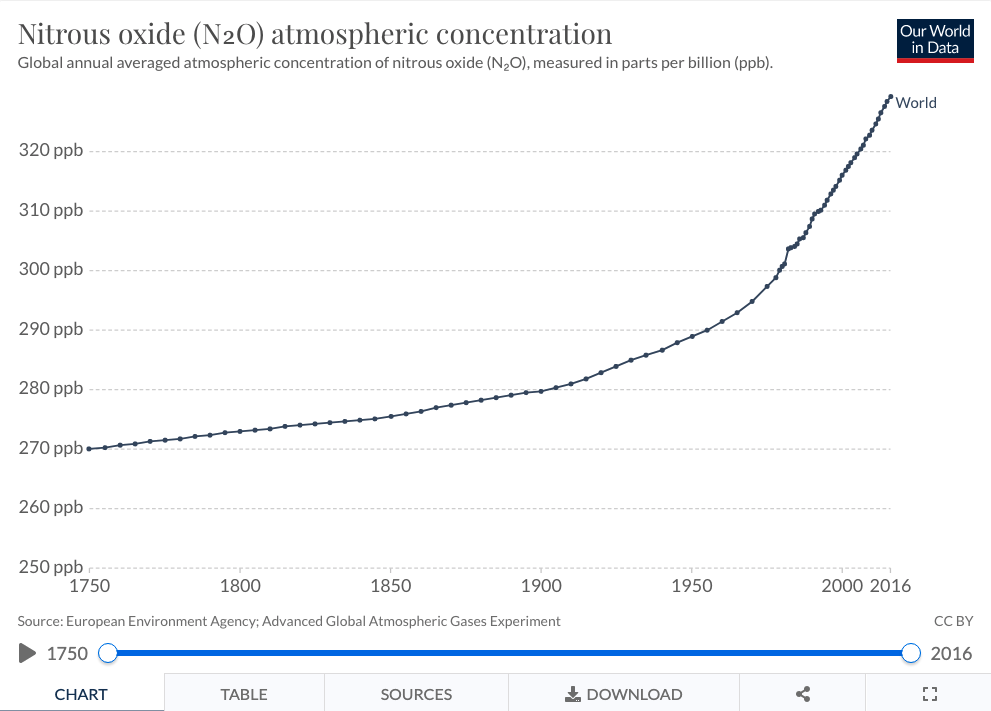
The nitrous oxide levels are now higher than ever in the past 800,000 years. Since the industrial revolution, the amount of nitrous oxide in the atmosphere has increased by 16%.
Nitrous oxide emissions are produced by both natural and human sources. The major natural sources include soils under natural vegetation, tundra and the oceans. Important human sources come from agriculture (nitrous oxide fertilizers, soil cultivation), livestock manure, biomass or fossil fuels combustion and industrial processes. In total, over one third of the emissions are estimated to come from human actions.
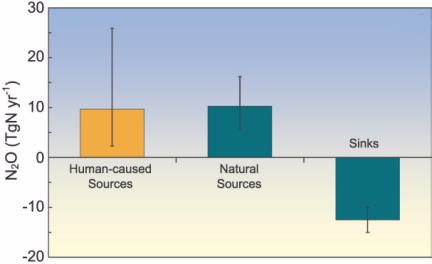
Credit: American Chemical Society
Atmospheric N2O contributions from human activities are now about the same as contributions from natural systems. However, N2O concentrations grew about two times faster from 1960 to 1999 than over any 40-year period of the two millennia before CY 1800. Nitrous oxide concentrations are measured in parts per billion – ppb.They have continued to grow at the same rate to a 2016 concentration of 324 ppb. The interactive chart shows the change in nitrous oxide (N2O) concentrations in the atmosphere over the past few centuries. N2O concentrations have increased significantly throughout the 20th century, and particularly sharply in the second half.
Nitrous Oxide N20 Concentrations – Interactive Graph
The increase in atmospheric N2O coincides with the rise of the use of nitrogenous fertilizers (agriculture is the largest source of N2O) and large increases in global food production. Natural sources of N2O include oxidation of ammonia in the atmosphere and from nitrogen in soils, particularly tropical soils. Human activities add to the soil source since nitrogenous fertilizers are used extensively in agriculture to feed an increasing planetary population. Smaller human activity sources include fossil fuel combustion, biomass burning, and decay of livestock manure.
The major sink for atmospheric N2O is destruction in the stratosphere where the majority undergoes photolysis to N2 + O. The remaining N2O reacts with O to produce NO, which can enter into a stratospheric ozone-depleting reaction cycle. Thus, N2O, like many halogen-containing gases, is important both as a greenhouse gas and as an ozone-depleting substance.
- Water Vapor: Water vapor takes the form of an invisible gas called water vapor (H2O). It is the most substantial natural greenhouse gas in the atmosphere and has a strong effect on water and climate. Changes in water vapor concentration have resulted from warming of the atmosphere rather than a direct result of human activities. As the temperature of the atmosphere rises, more water is evaporated from ground storages such as rivers, oceans, reservoirs, and soil. As water vapor is a greenhouse gas, more water vapor in the atmosphere leads to even more warming. This positive feedback loop in which water is involved is critically important to projecting future climate change.
- Ozone plays two different roles in the atmosphere. At ground level of the Earth’s atmosphere, tropospheric ozone acts both as a direct, warming greenhouse gas, and as an indirect controller of greenhouse gases’ lifetimes. In the second layer, stratospheric ozone has a cooling effect because it acts as a shield which filters out most of the ultraviolet light from the Sun. Ozone is created and destroyed by ultraviolet light from the Sun. It is created from oxygen by high energy rays, while low energy rays destroy it. Humans activities create various kinds of air pollution (e.g. traffic emissions, biomass combustion) which then reacts with sunlight to create ozone.Tropospheric ozone is estimated to have caused around one third of all the direct greenhouse gas related warming seen since the industrial revolution. Tropospheric ozone is a particularly difficult greenhouse gas to track because of its short lifespan in the atmosphere and the vast variations in its regional concentrations. Tropospheric ozone can affect the lifetime of some greenhouse gases. The breakdown of tropospheric ozone in sunlight leads to the production of hydroxyl (OH) radicals. These radicals help to diminish some other greenhouse gases, like methane, and hence lessen their global warming potential.
- Synthetic Greenhouse Gases: Almost all of the long-lived halogen-containing gases in the atmosphere are synthetic and did not exist in the atmosphere before the industrial era. Only a few such gases, for example, methyl bromide, methyl chloride, and tetrafluoromethane (CF4), occur naturally. The light orange bars in the figure below are the emissions in 1990 and the dark orange in 2002. The decrease in emissions of the chlorofluorocarbons (CFCs) is a result of the Montreal Protocol on Substances that Deplete the [stratospheric] Ozone Layer (1989 and subsequent revisions), an international agreement that has phased out the production and use of these gases, which are mainly used as refrigerants. The hydrochlorofluorocarbons (HCFCs) are in the process of being phased out by 2030. The Kyoto Protocol (2005) is aimed at phasing out or reducing the production and use of a number of greenhouse gases, including the hydrofluorocarbons (HFCs) and perfluorocarbons (PFCs), whose emissions are rising. The United States has not ratified this protocol.

The natural processes that remove perfluorocarbons like CF4 and C2F6 (emitted in aluminum production) and SF6 (an electrical insulator and used in the semiconductor industry) from the atmosphere are very slow, so these greenhouse gases will persist for many 1000s of years. The amounts in the atmosphere now and whatever is added in the future are permanent residents of our atmosphere. These long lasting synthetic greenhouse gases also absorb solar radiation extremely efficiently and include halocarbons such as CFCs (chlorofluorocarbons), HCFCs (hydrochlorofluorocarbons), and HFCs (hydrofluorocarbons). Halocarbons are used in propellants, refrigeration devices, air conditioning, certain types of heat pumps, and for foam plastic. Halocarbons are long lasting and powerful greenhouse gases. Other synthetic greenhouse gases are perfluorocarbons (PFCs) and sulphur hexafluoride (SF6).
- CFCs can remain in the atmosphere for over 102 years and have a 3,800 times more powerful warming effect than CO2. However, international regulations have effectively limited the emissions these gases, and the concentrations of most of these gases are now declining or at least leveling off.
- HFCs are used in the refrigeration and air-conditioning, aerosol, fire protection and foam-blowing industries and the concentration of these gases in the atmosphere continues to increase.
- PFCs are created in the making of aluminum and magnesium and in enriching uranium. They are also being used also in eye surgery. SF6 is used in power plants as an insulation gas, gas-insulated switchgear and circuit breaker equipment and in scientific applications.
References
| ↑1 | IPCC, 2013: Climate Change 2013: The Physical Science Basis. Contribution of Working Group I to the Fifth Assessment Report of the Intergovernmental Panel on Climate Change [Stocker, T.F., D. Qin, G.-K. Plattner, M. Tignor, S.K. Allen, J. Boschung, A. Nauels, Y. Xia, V. Bex and P.M. Midgley (eds.)]. Cambridge University Press, Cambridge, United Kingdom and New York, NY, USA, 1535 pp |
|---|---|
| ↑2 | [Lacis, A. A., Schmidt, G. A., Rind, D., & Ruedy, R. A. (2010). Atmospheric CO2: Principal control knob governing Earth’s temperature. Science, 330(6002), 356-359 |
| ↑3 | In 1824, Joseph Fourier calculated that an Earth-sized planet, at our distance from the Sun, ought to be much colder. He suggested something in the atmosphere must be acting like an insulating blanket. In 1856, Eunice Foote discovered that blanket, showing that carbon dioxide and water vapor in Earth’s atmosphere trap escaping infrared (heat) radiation. In the 1860s, physicist John Tyndall recognized Earth’s natural greenhouse effect and suggested that slight changes in the atmospheric composition could bring about climatic variations. In 1896, a seminal paper by Swedish scientist Svante Arrhenius first predicted that changes in atmospheric carbon dioxide levels could substantially alter the surface temperature through the greenhouse effect. In 1938, Guy Callendar connected carbon dioxide increases in Earth’s atmosphere to global warming. In 1941, Milutin Milankovic linked ice ages to Earth’s orbital characteristics. Gilbert Plass formulated the Carbon Dioxide Theory of Climate Change in 1956 |
| ↑4 | Global Bio-Chemical Cycles https://agupubs.onlinelibrary.wiley.com/doi/full/10.1029/2018GB006009 |
| ↑5 | Dlugokencky et al., 2011 |
| ↑6 | (Etheridge et al., 1998) |


