How Aviation Impacts Climate Change
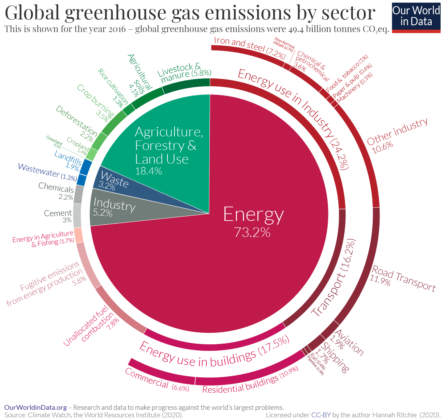
Aviation accounts for around 2.5% of global CO2 emissions, but its overall contribution to climate change is higher, closer to 3.5%. Aviation emits 11.6% of the total emissions from transport, which collectively account for 24% of all CO2 contributions to the atmosphere.
Figure 1 - Global CO2 Emissions from Transport
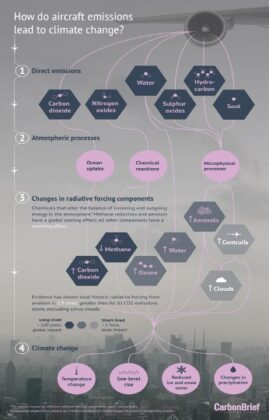
This is because air travel emits CO2 plus other gasses and pollutants including NO (nitrous oxide), water vapor, SO2 sulfur dioxide (SO2) and soot.
Combined, they all result in a long term...
GREENHOUSE GAS SOURCES
Greenhouse gases (GHGs) have both natural and human-created sources.
Natural sources include respiration and decomposition of plants and the ocean release of greenhouse gases to the atmosphere. Many natural GHGs occur naturally in the atmosphere, such as water vapor, carbon dioxide, methane and nitrous oxide.
Other greenhouse gases are synthetic i.e. human-made, include chlorofluorocarbons (CFCs), hydrofluorocarbons (HFCs), perfluorocarbons (PFCs) and sulphur hexafluoride (SF6).
Currently, human emissions of GHGs into the atmosphere has reached 50 billion tonnes on an annual...
THE GREENHOUSE EFFECT AND CLIMATE CHANGE
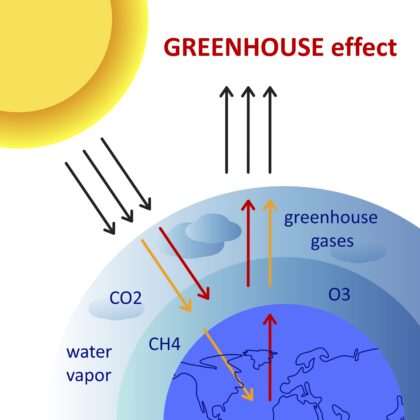
Strengthening of the greenhouse effect through human activities is known as the enhanced (or anthropogenic) greenhouse effect. The Boosted, .i.e. Enhanced greenhouse effect caused by human activities increases the atmospheric concentrations of both natural and synthetic greenhouse gases (GHGs). This accelerates the rise in global temperatures and leads to climate change.
Over the last century the burning of fossil fuels like coal and oil has increased the concentration of atmospheric CO2. This happens because the coal or oil burning process...
THE TYPES OF GREENHOUSE GASES
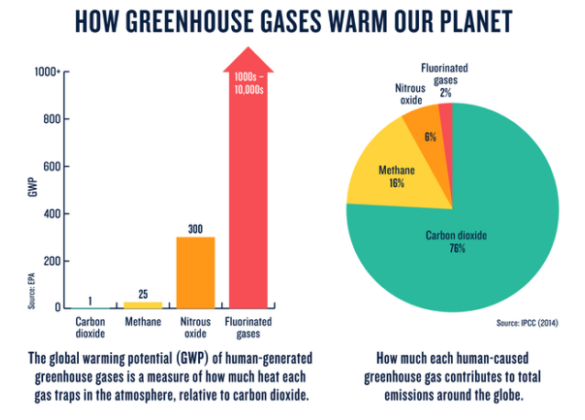
Earth’s greenhouse gases trap heat in the atmosphere and warm the planet. The main gases responsible for the greenhouse effect include carbon dioxide, methane, nitrous oxide, and water vapor (which all occur naturally), and fluorinated gases (which are synthetic). Greenhouse gases have different chemical properties and are removed from the atmosphere, over time, by different processes. Carbon dioxide, for example, is absorbed by so-called carbon sinks such as plants, soil, and the ocean. Fluorinated gases are destroyed only by sunlight in...
HOW THE GREENHOUSE EFFECT WORKS
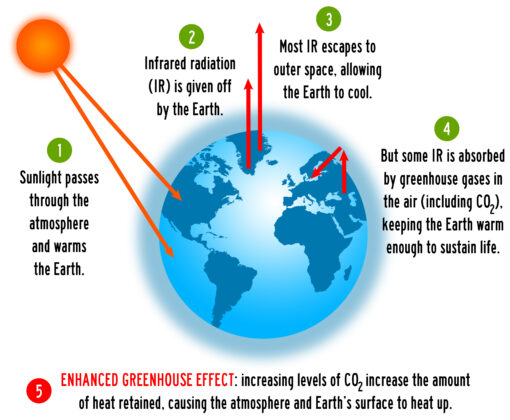
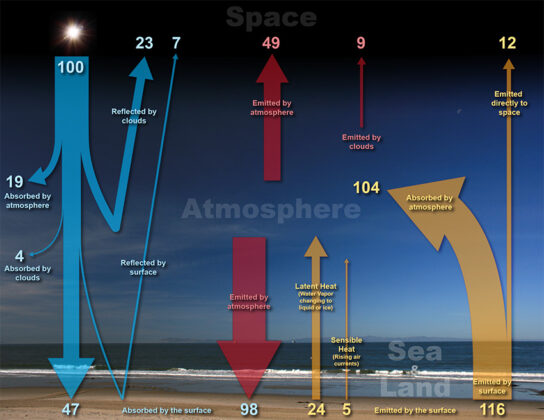
The Earth’s climate is a solar powered system, receiving light energy emitted by the Sun in the form of ultraviolet, visible, and near-infrared radiation. Globally, over the course of the year, the Earth system —land surfaces, oceans, and atmosphere— absorbs an average of about 240 watts of solar power per square meter (one watt is one joule of energy every second).
The absorbed sunlight drives photosynthesis, fuels evaporation, melts snow and ice, and warms the Earth system. The Sun...
CLIMATE CHANGE IS REAL
Climate change is defined as the changes in the long-term averages of daily weather, over time and geographic spac
Earth's climate has changed throughout history. In the last 650,000 years there have been seven cycles of glacial advance and retreat, with the abrupt end of the last ice age about 11,700 years ago. This abrupt ending of the last ice age marked the beginning of the modern climate era — and of human civilization.
Most climate changes are attributed to very...
CLIMATE VERSUS WEATHER
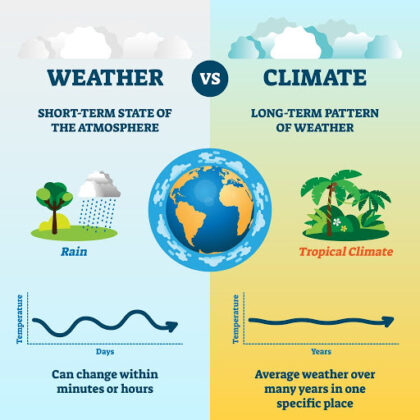
Climate is how the atmosphere "behaves" over long periods of time across geographic regions. Weather reflects short-term conditions of the atmosphere. The difference between weather and climate is the measure of time. The National Ocean Service (NOS - a division of the National Oceanic and Atmospheric Administration) states that Climate is what you expect, Weather is what you get!NOAA - National Ocean Service
Scientists define climate as the average weather for a particular region and time period, usually taken over...
THE GLOBAL AVERAGE TEMPERATURE ANOMALY
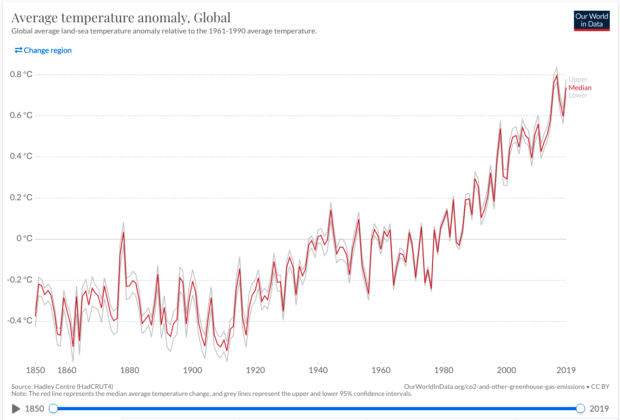
The “Average Temperature Anomaly - Global” graph in figure 1 shows the increase in global average temperature relative to the average of the period between 1961 and 1990. The red line represents the average annual temperature trend through time, with upper and lower confidence intervals shown in light grey.
It’s evident that over the last few decades, global temperatures have risen sharply. They are approximately 0.7℃ higher than the 1961-1990 baseline. Records show that temperatures, extended back to 1850, were...
Protecting Earths Habitability!
2020 was one of the hottest years in recorded history, according to data released today by NASA and the National Oceanic and Atmospheric Administration. According to NASA 2020 tied with 2016 for the hottest year in their books, while NOAA (whose records go back 141 years) placed it in the number-two spot NASA Says 2020 Tied for Hottest Year on Record; Andrea Thompson, Associate Editor Scientific American, Sustainability .
2020 is also an important marker of the power of...


