
Flight planning: Joslin Fld/Magic Valley Regional TWF / KTWF
What a pilot looks at before a flight from or to Joslin Fld/Magic Valley Regional in Twin Falls, Idaho, in plain English: right now VFR: good flying weather, Wind from the southwest (230°) at 7 knots. The warnings, reports and winds below come from the government's aviation weather service and the restrictions from the FAA, refreshed every few minutes. For planning, not a briefing: the legal preflight briefing comes from Flight Service (1-800-WX-BRIEF) or the FAA's own tools.
Warnings in force SIGMETs and AIRMETs whose area covers this field
- AIRMET ZULU 3C: moderate icing up to 22,000 ft.
- AIRMET TANGO 4W: moderate turbulence above 18,000 ft from 18,000 ft to 36,000 ft.
A SIGMET warns of weather hazardous to all aircraft (thunderstorms, severe turbulence or icing, volcanic ash); an AIRMET of weather that matters to small aircraft and to flying without instruments (moderate turbulence or icing, low cloud, strong surface wind, mountains hidden in cloud). An area is counted when it covers this field's position.
Pilot reports within 100 nautical miles, last three hours, nearest first
- PC12 at 14,000 ft, 50 nm northwest, 8:13 pm MDT (02:13 UTC): light turbulence up to 21,000 ft, light rime icing from 10,000 ft to 14,000 ft, -10 °C.
as filed, and in English
BOI UA /OV BOI117049/TM 0213/FL140/TP PC12/TA M10/TB CONS LGT 210 BLO/IC LGT RIME 140-100 /ZLC
- Report
- a routine report filed through BOI
- Where
- 49 nm southeast (117°) of BOI
- Time
- 02:13 UTC
- Height
- at 14,000 ft
- Aircraft
- PC12
- Temperature
- −10 °C
- Turbulence
- continuous light at 21,000 ft below
- Icing
- light rime from 14,000 ft to 10,000 ft zlc
- PC12 at 6,000 ft, 62 nm north, 7:09 pm MDT (01:09 UTC): scattered clouds up to 6,000 ft, remarks: multiple scattered layers during the descent runway 31.
as filed, and in English
SUN UA /OV KSUN/TM 0109/FL060/TP PC12/SK SCT-TOP060/WX FV05SM/RM MULTIPLE SCT LAYERS DURD RY31
- Report
- a routine report filed through SUN
- Where
- over KSUN
- Time
- 01:09 UTC
- Height
- at 6,000 ft
- Aircraft
- PC12
- Sky
- scattered clouds, tops 6,000 ft
- Weather
- flight visibility 5 miles
- Remarks
- multiple scattered layers during the descent runway 31
What pilots in the air told air traffic control or Flight Service: turbulence, icing, cloud tops and bases, temperature, wind, and whatever they remarked on (wind shear on final, a smooth ride). An urgent report is one of severe turbulence or icing, wind shear, or similar. Open "as filed, and in English" for the coded report and its translation line by line.
Winds and temperatures aloft forecast point PIH, 87 nm east of the field · for use 02:00–09:00 UTC
| Height | Wind from | Speed | Temperature |
|---|---|---|---|
| 6,000 ft | light and variable | ||
| 9,000 ft | 240° (southwest) | 13 knots | 1 °C |
| 12,000 ft | 240° (southwest) | 15 knots | -3 °C |
| 18,000 ft | 210° (southwest) | 42 knots | -15 °C |
| 24,000 ft | 200° (south) | 70 knots | -25 °C |
| 30,000 ft | 220° (southwest) | 74 knots | -29 °C |
| 34,000 ft | 220° (southwest) | 71 knots | -36 °C |
| 39,000 ft | 220° (southwest) | 62 knots | -43 °C |
Based on data from the 12th at 00:00 UTC; valid on the 12th at 06:00 UTC for use 02:00 to 09:00 UTC; temperatures above 24,000 ft are below zero. Heights are above sea level; the lowest rows are left out where the ground is already that high.
Temporary flight restrictions within 50 nautical miles, from the FAA's list
No temporary flight restriction within 50 nautical miles right now.
Each restriction opens the FAA's own page with the exact area, heights and times. Ordinary notices to air missions (a closed runway, lights out, a crane) are not shown here: the FAA's notice search is not open to sites like this one at this time, and the application for the FAA's data feed is in hand.
Radar and forecast charts government pictures, the latest each time the page loads
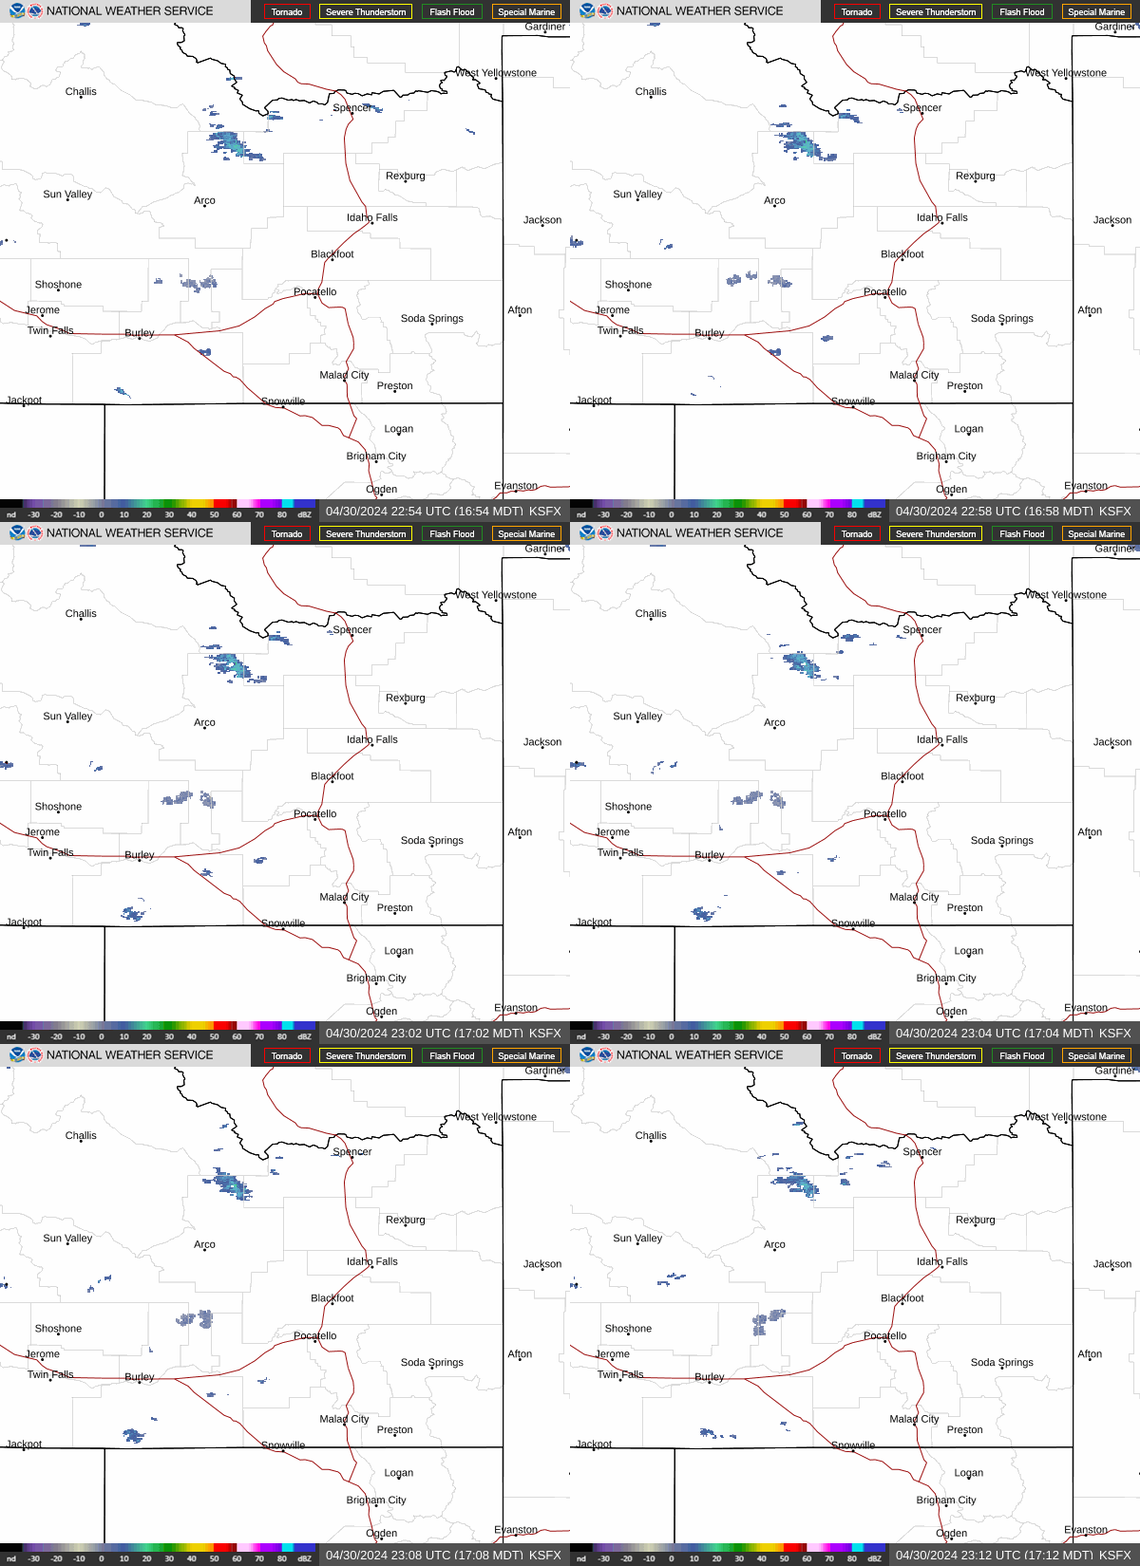
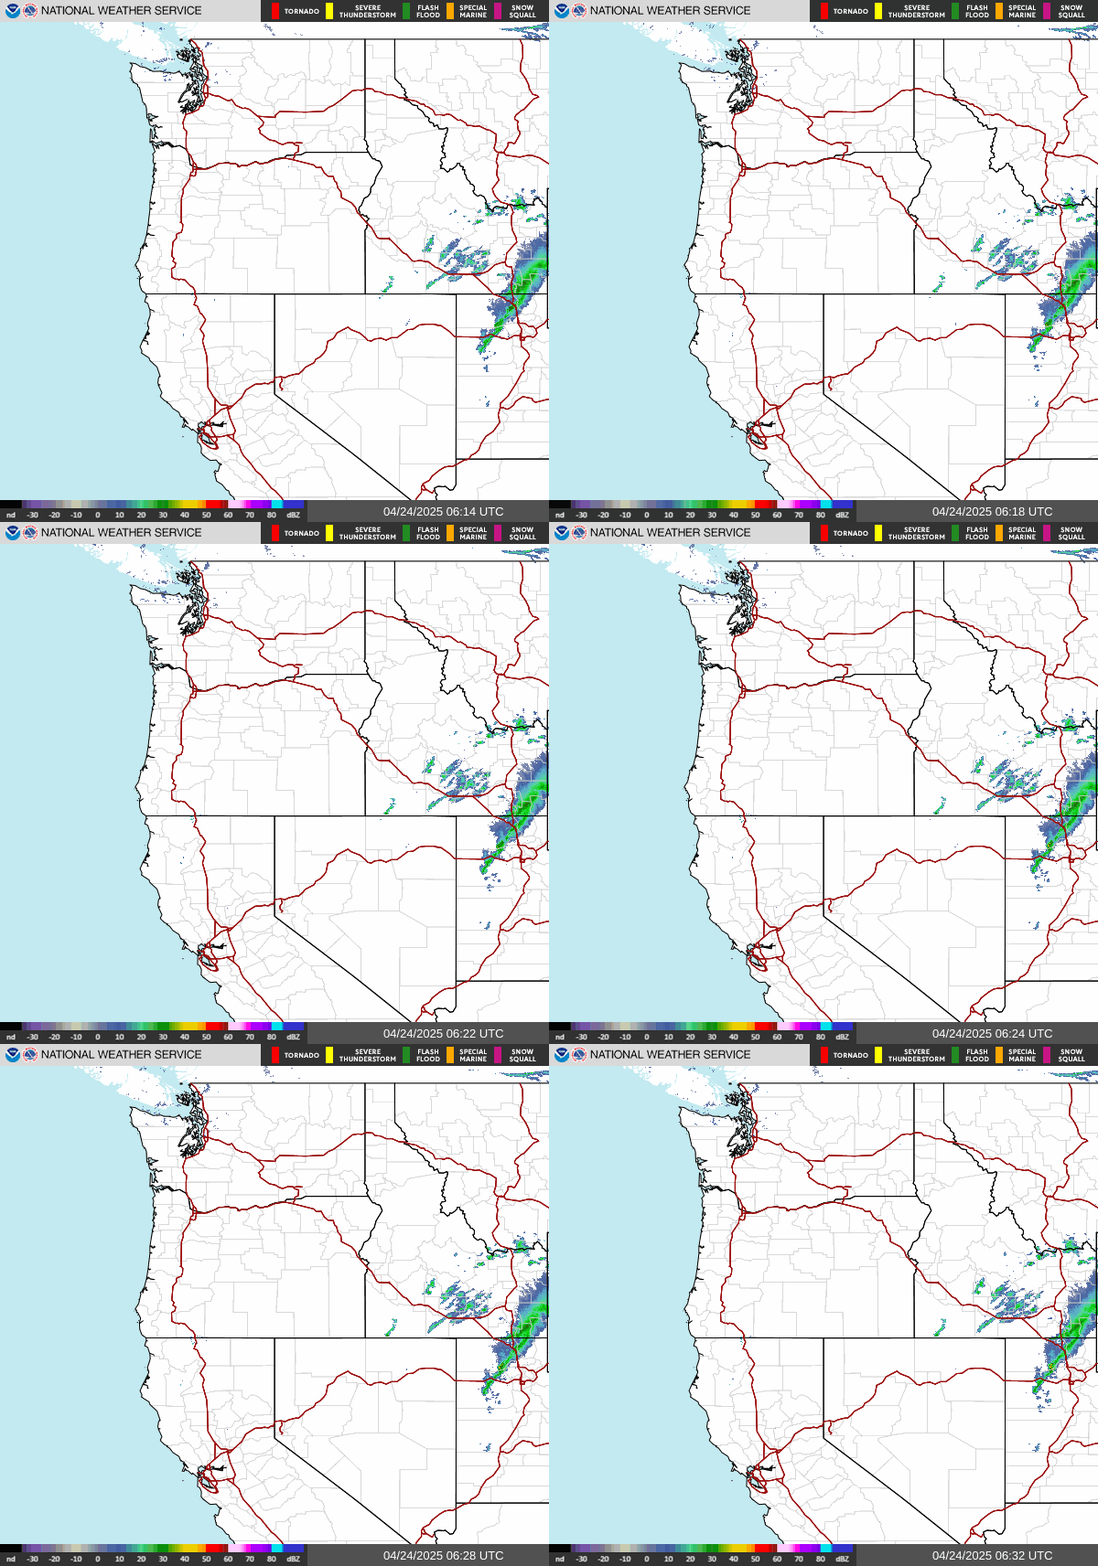
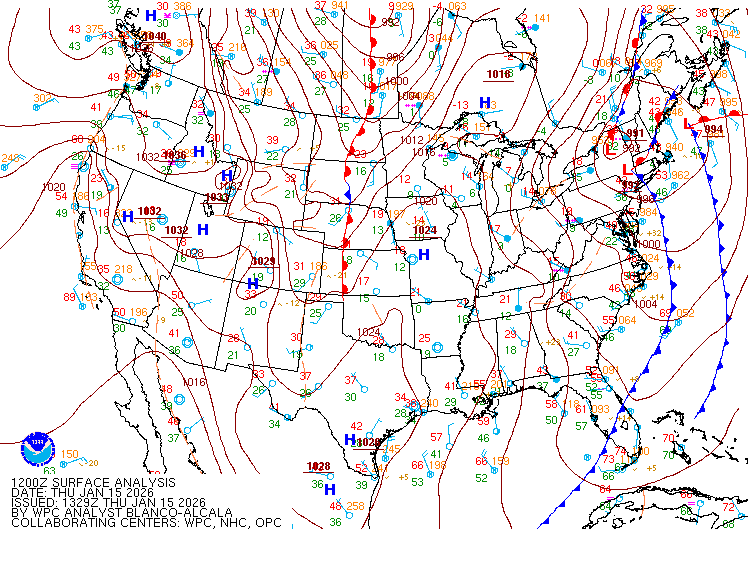
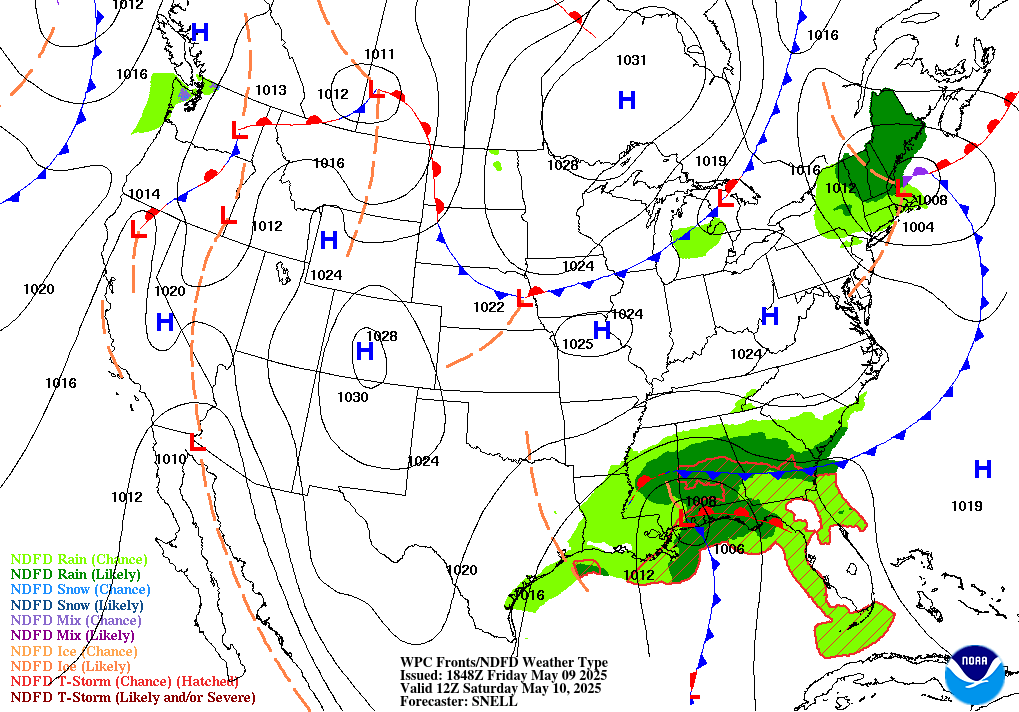
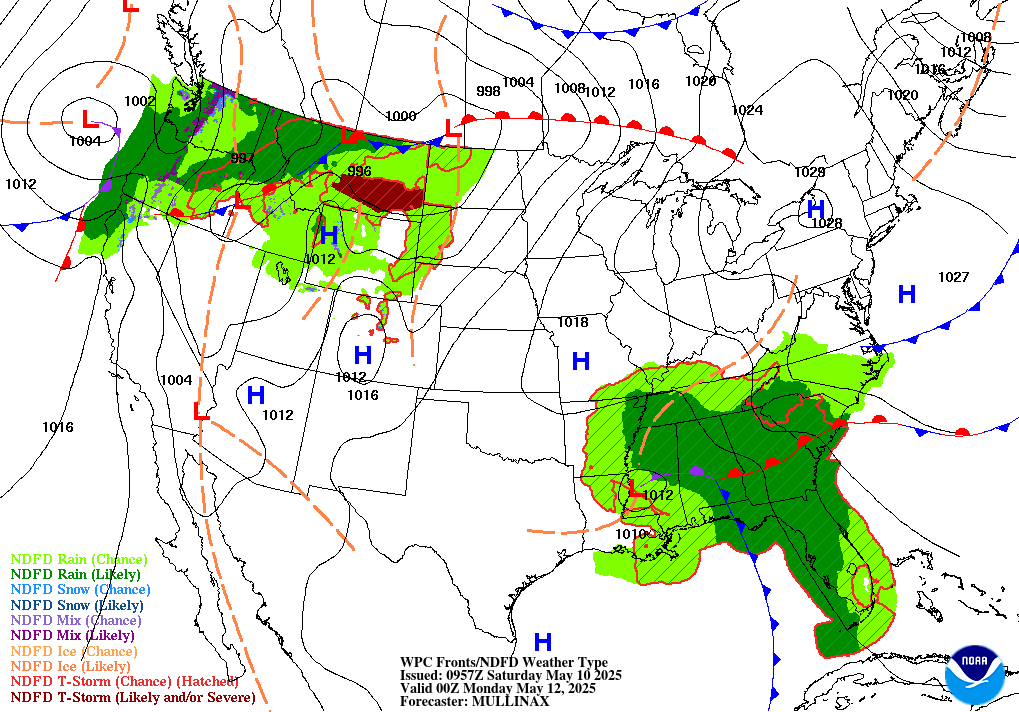
The radar pictures come from the National Weather Service (the nearest radar, then the region); the surface analysis and the 12- and 24-hour forecast charts from the Weather Prediction Center. They are public-domain government images shown as they are published.
Sources: the Aviation Weather Center's data service (SIGMETs, AIRMETs, graphical AIRMETs, pilot reports, winds and temperatures aloft), the National Weather Service radar, the Weather Prediction Center's charts, and the FAA's temporary flight restriction list and shapes. Fetched when the page is viewed and kept a few minutes. Back to Joslin Fld/Magic Valley Regional, where the current observation and the forecast for the field are.